Power BI for Construction Management: Consolidate Project Analytics & Reporting

Ifra Amin
Table of Contents
Introduction
The construction industry produces overwhelming data throughout a project’s life cycle. From planning to execution, this data is vital for effective management, decision-making, and analysis. But let’s face it—construction project data is often scattered, unorganized, and hard to visualize. This fragmentation makes it nearly impossible for project owners, supervisors, and managers to build a solid foundation for making well-informed decisions. Microsoft Power BI for construction management will help you transform how you handle project data, making it more accessible and easier to analyze. Instead of spending days trying to connect the dots across multiple systems, Power BI lets you bring everything together quickly and effortlessly.
Whether it’s ERP data in Excel or information from project management tools, Power BI quickly brings everything together. You’ll get a clear, real-time view of your construction company’s most critical metrics, making monitoring performance, identifying trends, and making confident, data-driven decisions easier.
In this blog, we will learn how to leverage Power BI for construction management to simplify project analytics and reporting. With multiple examples of Power BI dashboards, you will gain valuable insights to optimize your construction projects.
Common Challenges in Construction Analytics
Data analytics in construction is still evolving, and the industry is grappling with the consequences of poor data management. According to a joint study by FMI and Autodesk, the construction sector lost a staggering $1.84 trillion in 2020 due to mismanaged data. Alarmingly, 14% of all construction rework was directly tied to bad data, reflecting how critical accurate data is to successful project execution.
Despite its importance, only 55% of construction companies have implemented a formal data strategy, leaving critical information unorganized and underutilized. This gap often leads to poor decision-making and costly rework. The rapid increase in data generation further exacerbates the problem. Between 2019 and 2021, the amount of data produced in the construction industry grew by a staggering 200%, yet 96% of this data goes unused, according to the same FMI report.
Looking ahead, the volume of data is expected to grow at an unprecedented pace. Data volume in the United States will expand at a 61% compound annual growth rate through 2025.
Here are some of the key hurdles that construction managers like you might face (and that can be solved by Power BI for construction management):
- Data Fragmentation: Information is often siloed across multiple tools, such as project schedules, budgets, and on-site reports, making it difficult to gain a holistic view.
- Delayed Insights: Manual reporting processes slow down the ability to act on critical information, leading to missed opportunities for proactive decision-making.
- Monitoring KPIs: Tracking essential metrics like cost, time, and resource allocation becomes cumbersome without a unified, real-time data solution.
Why Power BI is the Right Tool for Construction Management
A common misconception about construction data analytics is that it’s only suitable for large corporations with vast resources and enormous data sets. While bigger firms may have an edge in terms of resources, small- and medium-sized construction companies stand to gain just as much—if not more—from adopting the right tools and leveraging the insights they provide.
The key to success in data analytics lies in defining clear goals and developing strategies aligned with those objectives. For example, data analytics has helped MEP contractors identify significant issues impacting profitability. In some cases, detailed margin analyses have revealed margin erosion of up to 17%, with equipment costs exceeding budgets by as much as 55%, leading to substantial financial losses over time. Insights like these, enabled by tools like Power BI, can save companies from similar pitfalls.
Power BI is built to work for construction companies of any size, offering a flexible, cost-friendly, and easy-to-use solution. It helps you bring all your scattered data into one place, saving time on reporting and giving you real-time insights into what’s really happening. Whether you need to track project budgets, figure out where equipment costs are piling up, or see how profitable a client really is, Power BI gives you the clarity to make confident, informed decisions that move your projects forward.
Implementing a Construction Analytics Dashboard Using Power BI
A well-designed construction dashboard in Power BI can revolutionize how your team visualizes and interacts with project data. While creating such dashboards involves several steps, leveraging expert support ensures your business gets the most value out of this powerful tool. Here’s an overview of what goes into building a vigorous and insightful dashboard:
- Data Integration: Start by connecting your data sources to Power BI. These could include Excel sheets, databases, or more sophisticated systems like ERP and project management software. Power BI’s versatility ensures seamless integration with most data formats and systems, helping you consolidate scattered data into a single source of truth.
- Data Transformation: Use Power BI’s Query Editor to clean, structure, and transform your data into a format ready for analysis. Organize your data hierarchically to reflect project phases, teams, or KPIs. Data preparation ensures the accuracy and relevance of the insights your dashboard delivers.
- Visualization: Power BI offers a rich library of visualization options, including bar charts, pie charts, Gantt charts, and heat maps. Tailor your dashboard by selecting visuals that effectively represent your data and align with your project goals. Dynamic linking between these visuals and data sources ensures your dashboard stays updated in real-time.
- Interactivity: Enhance usability with interactive features like slicers, drill-throughs, and tooltips. These tools empower users to navigate seamlessly between high-level overviews and detailed data points, providing actionable insights at every construction management level.
- Share and Collaborate: Once your dashboard is finalized, publish it to the Power BI Service. This allows stakeholders across your organization to access and collaborate on insights in real-time, fostering a data-driven decision-making culture.
Curious to see How Power BI can Help your Construction Project Analytics?
Request a free demo of Salesforce Marketing Cloud Intelligence and experience the power of data-driven marketing! Request a free demo to get started.
Request a DemoHow to Import Your Construction Data into Power BI:
Power BI supports multiple methods of importing data, making it a flexible tool for construction projects of all sizes. Here are the main ways you can consider importing construction data into Power BI:
1. Manual Data Entry
- When to Use: Ideal for small datasets or specific one-time data inputs.
- Challenges: This method can be time-consuming and prone to human error, making it less suitable for recurring data needs.
2. Direct Data Import
- Excel Spreadsheets: Import data directly from Excel files, especially for smaller datasets or when exporting data from project management tools.
- CSV/Text Files: These are common export formats from various systems, and these files can also be directly imported into Power BI.
3. Database Connections
- SQL Server: Connect Power BI to SQL Server databases to access large-scale data for advanced analytics.
- Other Databases: Power BI supports thousands of databases like MySQL, PostgreSQL, and Oracle, ensuring compatibility with most enterprise systems.
4. Cloud-Based Services
- Microsoft Azure: Integrate seamlessly with Azure SQL Database, Blob Storage, or other Azure services to leverage cloud-hosted data.
- Other Cloud Platforms: Power BI can connect with Amazon Web Services (AWS), Google Cloud, and other major platforms based on your data hosting needs.
5. API Integration
- Construction Management Software APIs: Construction management software like BUILDFitters can synchronize data into Power BI through API integrations, streamlining your data pipeline for real-time updates.
For more information, head to our blog that illustrates how you can connect data sources to Power BI: How to Integrate Multiple Data Sources in Power BI
What Kind of Power BI Reports Can You Create for Construction Projects?
The examples below will give you a good idea of basic reports that can help make your day-to-day construction reporting and analytics tasks easier:
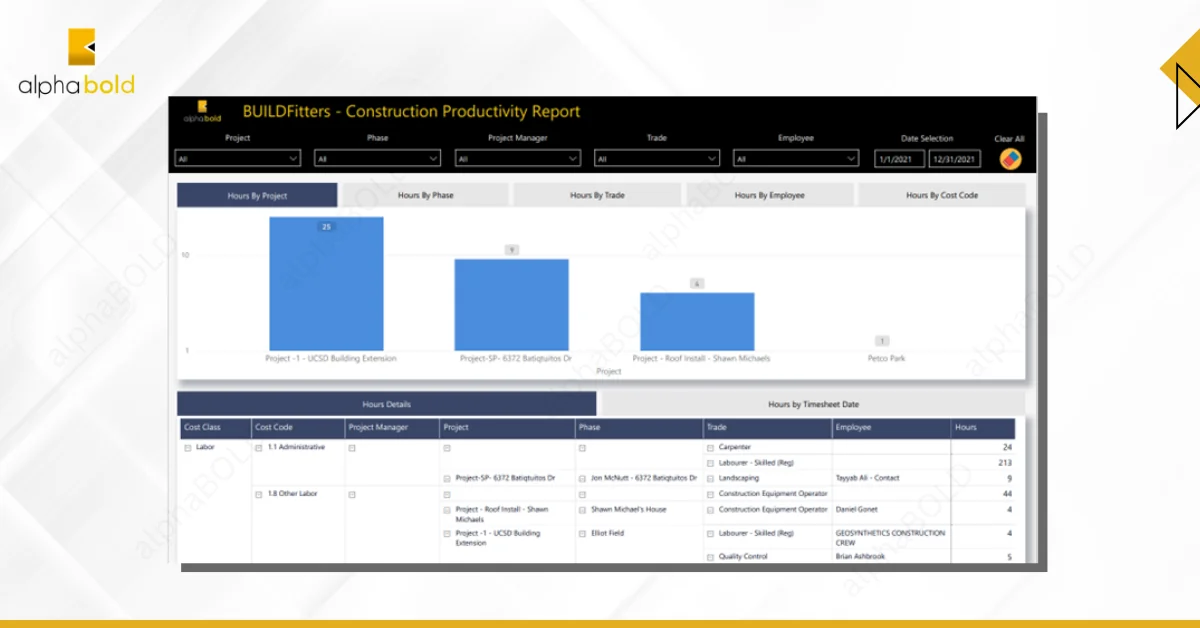
Progress Tracking Reports: With Power BI, you can create a report to visualize project progress by comparing completed tasks with planned ones. This report can include Gantt charts that display task schedules on a timeline, along with metrics like percentage completion, remaining work, and task dependencies. These insights help you spot delays, understand their root causes, and predict project timelines more accurately.
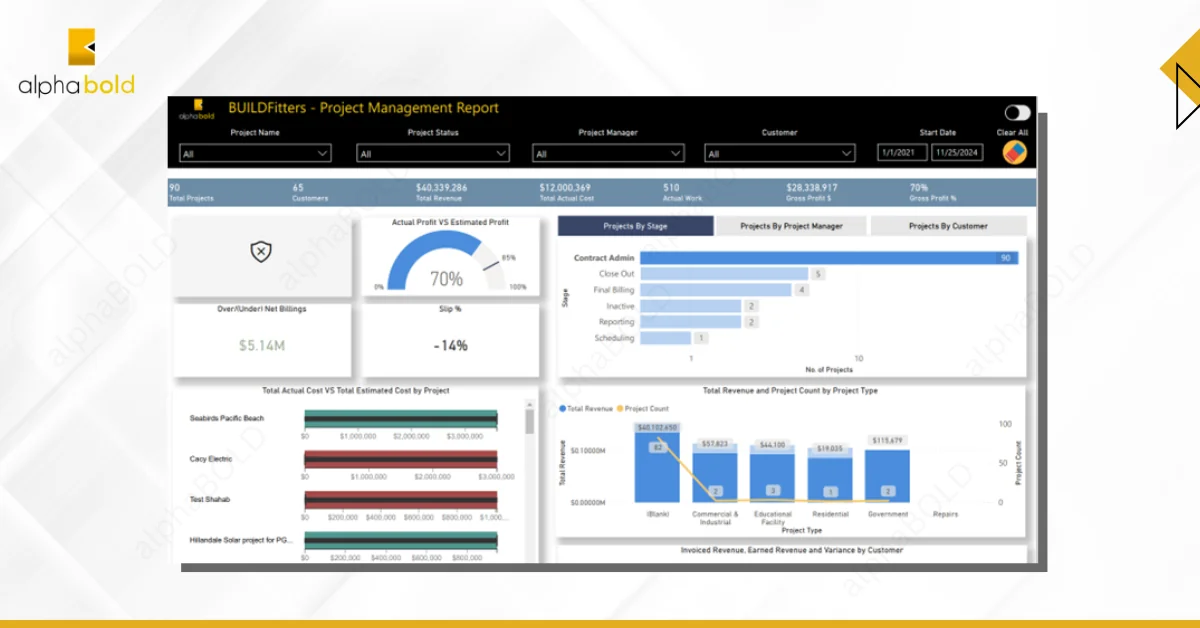
Budget Monitoring Reports: You can build a report that provides real-time insights into project expenses, covering labor, materials, and equipment. This report can potentially include detailed breakdowns of costs, comparisons of actual vs. budgeted expenses, and cost variance analysis. It will help you identify areas of overspending and take corrective actions to keep projects within budget.
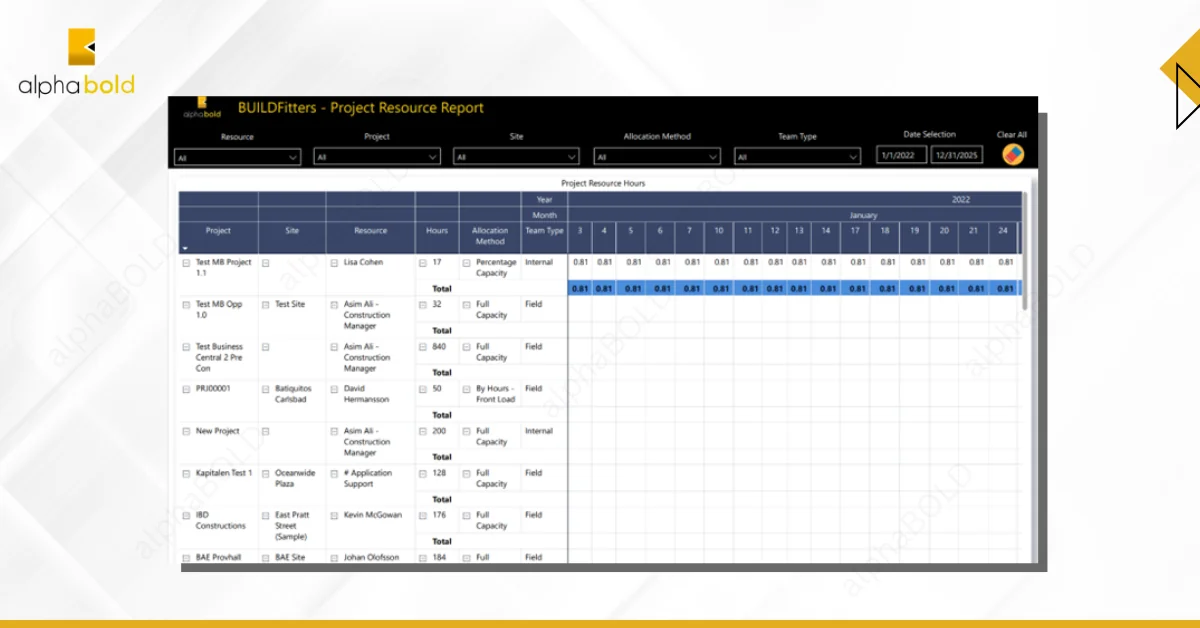
Resource Allocation Reports: You can create a Power BI report to optimize resource usage across projects. This report can feature a resource utilization matrix showing labor, equipment, and materials availability and usage rates. By identifying underutilized resources and reallocating them where needed, you can help improve efficiency and reduce unnecessary costs.
Explore the best Power BI dashboards for executives in our recent blog: Power BI Executive Dashboards for Data-Driven Leadership
Real-world Applications of Power BI for Construction Management
Are you still confused about implementing Power BI for your construction management project? Here’s how companies and construction businesses have previously used project analytics and reporting capabilities of Power BI for their benefit:
1. You Can Get Real-Time Inights for Smarter Decision-Making:
One of the keyways Power BI helps the construction industry is by providing companies with data-driven insights that guide decision-making.
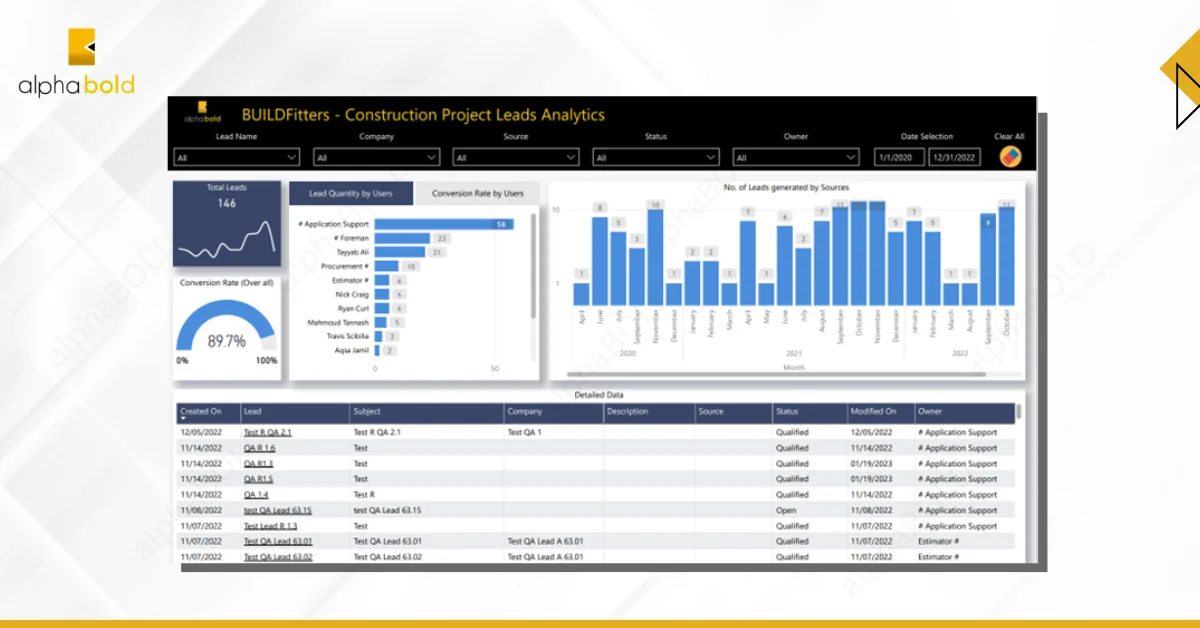
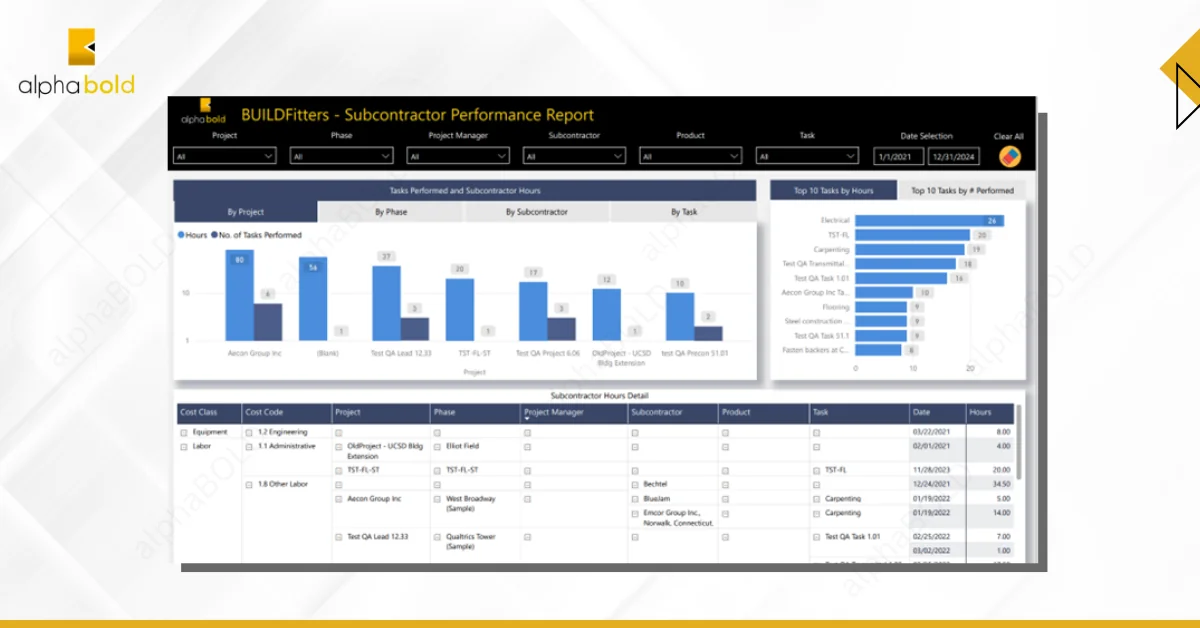
For instance, consider a large construction project involving multiple subcontractors. By consolidating data like project timelines, resource allocation, and budgets into one centralized platform, Power BI enables construction managers to monitor the project’s health in real-time. This means they can make proactive adjustments to ensure the project stays on track, optimizing resources and improving overall efficiency.
2. You Can Make Informed Predictions with Accurate Forecasts:
3. Project Managers Can Modernize Documentation and Compliance Tracking:
4. You Can Enhance Safety and Quality Assurance:
Optimize your Construction Reporting with Power BI
Simplify data consolidation and generate powerful visual reports for better project management.
Request a DemoConclusion
Projects in the construction industry are growing increasingly complex. Therefore, utilizing tools like Power BI is no longer just optional. With Power BI for construction management, your company can move beyond traditional management methods to embrace data-driven strategies that save time, reduce costs, and improve outcomes.
From real-time insights and trend forecasting to simplified compliance tracking and enhanced safety, Power BI will enable smarter, faster decisions at every stage of a project. Your investment in Power BI won’t just help you stay competitive—it will future-proof your construction business in an industry where data is the new foundation for success.
AlphaBOLD, with an exceptional team of Power BI consultants, can help construction managers and leaders to convert their fragmented data sources into meaningful visualizations. Our team can help you get the clarity you need to tackle challenges proactively and seize opportunities for growth.
Explore Recent Blog Posts


