Introduction
When it comes to leveraging artificial intelligence (AI) for smarter decision-making and data analysis, Power BI AI capabilities are leading the way as one of the most innovative business analytics solutions in 2024. In this blog, we’ll explore the latest AI features in Power BI, showcasing how these cutting-edge tools streamline data analysis, uncover hidden insights, and enhance business intelligence for users at every level, from executives to data analysts. To understand the growing importance of AI in business intelligence, consider these statistics:
According to a Forbes, 44% of company owners recognize AI as a crucial tool for enhancing decision-making processes.
Signal AI survey findings show that 79% of businesses re already using AI to inform their decision-making.
An impressive 92% of those surveyed express strong support for using AI to improve decision-making efficiency.
Additionally, nearly all CEOs (96%) feel optimistic about AI’s role in empowering them to make more informed, data-driven decisions.
These figures highlight why organizations are increasingly turning to advanced platforms like Power BI, where AI capabilities are making a significant impact on how businesses analyze data, forecast trends, and derive insights that drive smarter decisions. In 2025, Power BI’s AI tools will be at the forefront of this shift, helping organizations harness the power of AI for real-time data insights and predictive analytics.
Power BI as a Complete BI Platform: Leveraging AI for 2024 and Beyond
Microsoft Power BI has evolved into a leading platform for data visualization and business intelligence, empower organizations to transform raw data into actionable insights. In 2024, Power BI’s capabilities have expanded significantly, integrating advanced AI features that enhance how users analyze, interpret, and visualize data. These Power BI AI capabilities allow businesses to unlock deeper insights, automate tasks, and improve decision-making processes, all from a unified platform.
Power BI’s bread and butter lies in its robust data integration. Users can seamlessly connect to a vast array of data sources- whether in the cloud, on-premises, or across databases and spreadsheets. Through Power Query , users can clean, transform, and model this data to prepare it for in-depth analysis.
Data visualization remains one of Power BI’s strongest features, with dynamic and interactive graphs, charts, tables, and maps that bring data to life. With these tools, users can easily detect trends, outliers, and patterns, providing a clear understanding of complex datasets. The platform’s advanced analytics are further enhanced by AI-powered visualizations that automatically generate insights, identify anomalies, and suggest key influencers driving business outcomes.
Another critical advantage of Power BI is the Data Analysis Expressions (DAX) language, which allows users to perform sophisticated calculations and queries, empowering teams to extract precise and meaningful insights from their data models.
Incorporating the latest AI capabilities in Power BI, users of all skill levels can now leverage machine learning, natural language processing, and predictive analytics to enhance their business intelligence workflows. These cutting-edge AI features make Power BI an indispensable tool for modern organizations, helping them stay competitive and data-driven in an ever-evolving market.
Understanding AI in Power BI: Why Is it Important?
AI-driven decision intelligence is the next evolution of business intelligence, and Power is at the forefront of the transformation. Power BI AI capabilities allow users to go beyond traditional analytics by leveraging machine learning, natural language processing, and automated insights. These tools make it easier for users to derive meaningful insights from their data, empowering businesses to make data-driven decisions faster and more efficiently. Whether you’re forecasting trends, or identifying anomalies, Power BI’s AI features play a critical role in guiding smart business strategies.
“The Pareto Principle for Data Analysts” can be useful to understand the importance of AI-based data analytics. The Pareto principle stresses how you should only focus on the 20% that has the 80% impact. Think of Power BI and AI in the same context. You can do the most tedious tasks with the help of the AI features and get 80% of the required results.
AI capabilities in Power BI improves conventional data analytics by automating routine tasks and enabling more natural interactions with data. Key features include:
Automated Insights quickly detect trends, patterns, and outliers, helping users uncover hidden insights effortlessly.
Natural Language Queries simplify complex searches, allowing users to interact with their data more naturally and speed up decision-making processes.
Advanced Data Modeling Techniques provide more accurate forecasting and predictions, making data analysis both reliable and insightful.
These features democratize data analysis, making it accessible to users of all skill levels and empowering them to derive meaningful insights with ease.
Key AI Capabilities in Power BI for 2024
When employees can leverage AI to boost company results, it truly opens up a world of possibilities. Power BI has always been ahead of the curve in this space, embracing AI features like Quick Insights and Natural Language Processing (NLP) to enhance business intelligence. These tools are reshaping how we interact with data, making it easier than ever to extract meaningful insights with just a few clicks.
Here’s a closer look at some of the key AI features in Power BI that are changing how businesses approach data-driven decisions in 2024.
1. Natural Language Query (NLQ): Conversational Data Interaction
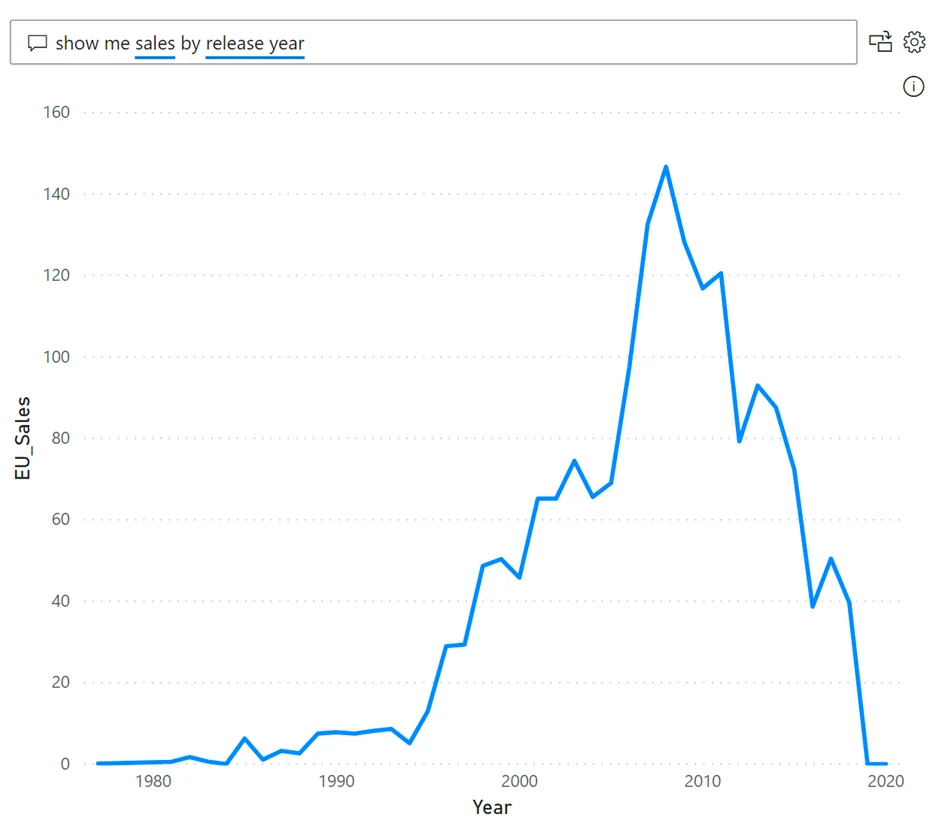
One of the standout AI-driven features in Power BI is the Natural Language Query (NLQ). It lets you engage with your data as if you were having a conversation—just type in a question, and Power BI quickly pulls relevant information from your datasets. What’s really exciting is that you don’t need to be a data expert to use it. With the help of AI and machine learning models, NLQ makes it easy for anyone to explore metrics and analyze data in real-time.
No more navigating complex menus or memorizing formulas—NLQ transforms the search process. It even helps you fine-tune your queries by offering suggestions based on the data you’re analyzing. For example, if you’re unsure how to frame a query, Power BI might recommend relevant questions or highlight important terms. And yes, you can even customize how the system color-codes words, so you know exactly where it stands with your query. Blue for terms it recognizes, red for anything unclear, and orange for unknowns.
But it doesn’t stop there—Power BI’s Quick Insights feature goes a step further, providing automatic visualizations like maps, tables, and charts. These AI-powered visualizations make it easy to spot patterns or trends at a glance, without needing to dig into the data manually.
2. Anomaly Detection: Identifying Data Irregularities in Real-Time
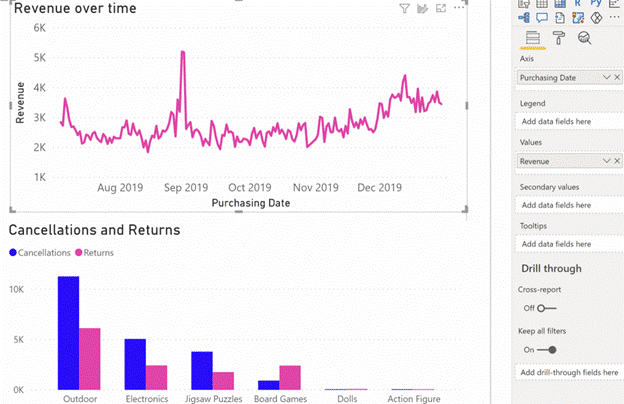
With Power BI’s Anomaly Detection, catching unexpected trends and outliers in your data has never been easier. This AI-powered feature automatically scans your time series data, highlighting anything that doesn’t quite fit the pattern—without the hassle of manually slicing data. What’s great is that you can customize the sensitivity of the detection, making sure Power BI flags the anomalies that matter most to you.
Once an anomaly is detected, Power BI doesn’t just stop there. It offers detailed explanations in the Insights Pane, breaking down the potential causes behind the irregularities. Even better, it ranks these contributing factors based on their impact, helping you decide where to focus your attention first.
You can also fine-tune how anomalies are displayed in your reports, making sure the visual presentation matches your preferences. And whether you’re working on Power BI Desktop or using the Power BI service, these insights are available wherever you need them.
With the latest 2024 update, Anomaly Detection is now fully accessible through Power BI’s mobile apps, meaning you can monitor and analyze any unusual data changes from your phone. Whether you’re in a meeting or out of the office, you’ll get real-time notifications for any sudden spikes or drops in your data, keeping you in the loop no matter where you are.
3. Key Influencers: Understanding the Drivers Behind Your Data
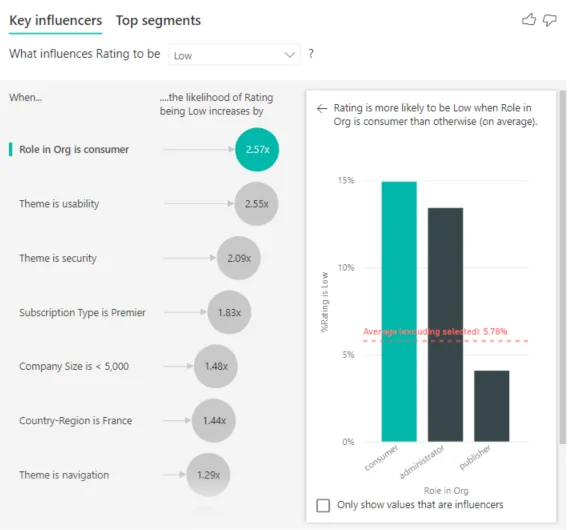
Key Influencers is one of Power BI’s most powerful AI-driven visuals, giving you a clear view into what’s really driving your business metrics. Whether you’re tracking revenue, product sales, or customer churn, this tool helps you break down the “why” behind your data, showing you which factors are influencing your outcomes.
The beauty of Key Influencers is that it doesn’t just stop at showing you results—it digs deeper, correlating different variables to explain how and why certain factors are impacting your data. This feature goes beyond surface-level analytics by helping you uncover those key drivers, so you can make informed decisions with confidence.
With the latest updates in Power BI, the Key Influencers visual now provides even more advanced insights. For example, it now considers non-linear relationships alongside linear ones, which gives a more complete picture of what’s influencing your metrics. This is especially useful for identifying patterns that might otherwise be missed with traditional analysis.
You’ll see a ranked list of factors, complete with scores that show how strongly each one impacts your target metric. And for those who love visuals, Key Influencers also delivers clean, intuitive graphs that make it easy to see the connections between your target variable and its influencers.
The tool is designed to be user-friendly, even for those without a data science background. With just a few clicks, you can pinpoint the drivers behind your data and instantly visualize the relationships that matter most to your business.
4. Decomposition Tree: Breaking Down Data for In-Depth Analysis
The Decomposition Tree in Power BI is one of the most intuitive ways to break down your data, offering an AI-powered approach to understand complex metrics. Whether you’re looking to analyze sales performance across regions or break down customer satisfaction by demographics, the Decomposition Tree helps you dive deep into your data—step by step.
What makes this tool stand out is how it allows you to explore multiple categories at once. You start with a root value, like total sales, and from there, Power BI automatically creates branches based on different factors that influence that metric. It’s a perfect way to see how different dimensions—like location, product category, or time—contribute to your overall results.
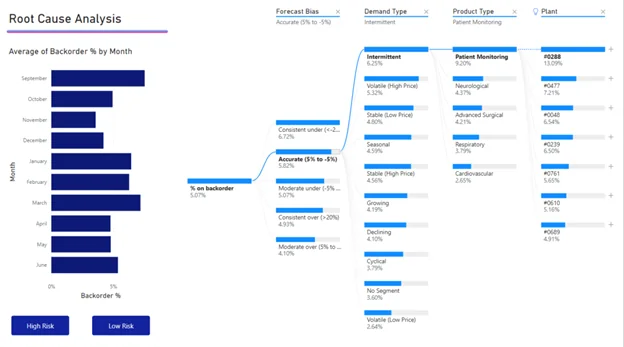
The latest updates have made the Decomposition Tree even smarter, using AI to recommend the most impactful splits in your data. Instead of manually testing every possible category, Power BI’s AI suggests the next best factor to explore, making it faster and easier to uncover insights.
For those who love to customize, this tool lets you sort, filter, and color-code nodes, making it visually engaging while also being incredibly functional. You can dig deeper into any specific branch, and with just a few clicks, you can rearrange or filter the data to fit your needs. Power BI’s Decomposition Tree even supports complex filtering and keyboard combinations, giving you flexibility to analyze data exactly how you want.
Even though it’s packed with powerful features, the Decomposition Tree remains user-friendly and approachable. Whether you’re an analyst or a business leader, it offers a clear, visual way to break down your data and understand the key factors driving your outcomes—without the need for technical expertise.
5. Sentiment Analysis: Gauging Customer Emotions Through AI
Sentiment analysis in Power BI takes the guesswork out of understanding how your customers feel. Using natural language processing (NLP), Power BI can analyze text from sources like product reviews, social media comments, or customer feedback and determine whether the sentiment is positive, negative, or neutral. This AI-powered tool gives businesses a clearer picture of how their audience really feels.
But it goes even deeper. With sentiment analysis, Power BI doesn’t just stop at “good” or “bad.” You can use it to identify specific emotions, like happiness, frustration, or even sadness, which can provide critical insights into how your customers feel about the quality of your products and services.
Want to know how engaged your customers are? Power BI’s AI capabilities can help you gauge interest levels in a particular topic or product, whether it’s for a single person or an entire group. You can even measure the urgency of a task or how strongly a message resonates with your audience.
For businesses with specific needs, sentiment analysis can be tailored to your goals. Data scientists and analysts can customize the analysis to extract the exact insights they need—whether it’s understanding purchase intent or predicting customer churn.
By identifying and interpreting customer emotions, Power BI’s text analytics offers more than just data—it helps you connect with your customers on a deeper level, understanding their needs and improving your business strategies accordingly.
It’s Time to See the Full Potential of your Data!
Imagine having the power to make data-driven decisions with ease, backed by AI insights that highlight trends you might have missed. Let's connect and schedule a personalized demo where you can see exactly how Power BI’s AI features can change your business intelligence processes.
Request a Demo6. AI-Powered Forecasting: Accurate, Data-Driven Predictions
Forecasting with Power BI helps with dynamic reference lines when it comes to visualizations. It first examines all sorts of data, such as time series, real-time, and cross-sourced, to reveal significant trends and insights that might influence market behavior. An important part of predictive analytics is looking at past data to see if there’s any way to study consumer behavior and anticipate occurrences that can impact AI customer insights.
AI and BI allow for more accurate and dependable forecasts by utilizing machine learning algorithms to analyze complicated and non-linear data. It detects irregular fluctuations and seasonal trends that humans would miss. It also constantly adapts and improves projections using freshly generated data.
7. Quick Insights: AI-Generated Visuals at the Click of a Button
Power BI’s Quick Insights makes discovering patterns in your data effortless. With just a click, this AI-powered feature analyzes your dataset using advanced algorithms, instantly generating visuals that highlight key trends, outliers, and correlations.
Getting started is simple. All you need to do is select your dataset and click “Get quick insights.” From there, Power BI goes to work, scanning your data and surfacing valuable insights—without requiring any complex setup or technical expertise. Within moments, you’ll have a variety of visualizations to explore, from charts to graphs, all driven by AI.
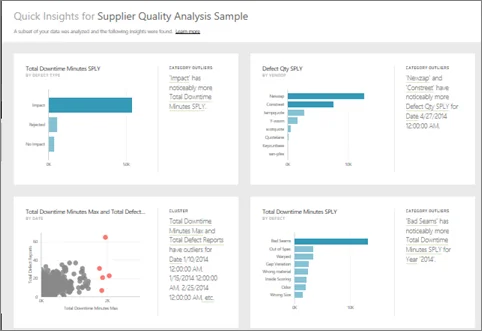
To get the most out of Quick Insights, having a well-structured data model is key. The better your data is organized, the sharper and more accurate the insights Power BI can provide. Once the analysis is complete, you can easily click “View Insights” to browse through the automatically generated visuals and decide which ones you want to pin to your dashboard for further exploration.
This feature is perfect for users of all skill levels—whether you’re an executive looking for a quick overview or a data analyst seeking hidden patterns. It takes the complexity out of data analysis, delivering impactful insights with just a few clicks.
8. Azure Cognitive Services: AI Models for Advanced Data Processing
Power BI takes AI to the next level with Azure Cognitive Services, offering some of the most advanced, pre-trained AI models available. These cognitive services allow users to tap into cutting-edge AI capabilities for tasks like language recognition, sentiment analysis, and even image tagging—without needing to build complex models from scratch.
What makes Azure Cognitive Services so powerful is its flexibility. Delivered through APIs and containers, these AI models can be customized to fit your specific needs and integrated seamlessly into your Power BI dataflows. Whether you’re working in the cloud or at the edge, you can apply these models directly to your datasets for advanced data processing.
Here’s a look at what you can do with Azure Cognitive Services in Power BI:
- Recognize over 120 languages automatically, making it easier to process global data.
- Extract key concepts from unstructured text, turning messy data into valuable insights.
- Analyze emotions in short texts, helping businesses understand customer sentiment.
- Tag over 2,000 items in images, simplifying image classification and analysis.
These AI models help reduce the heavy lifting for data analysts, taking care of time-consuming tasks like data cleaning and labeling, so teams can focus more on strategy and less on manual work. With self-service AI like this, even those without deep technical expertise can leverage these powerful tools to gain faster, more accurate insights from large datasets.
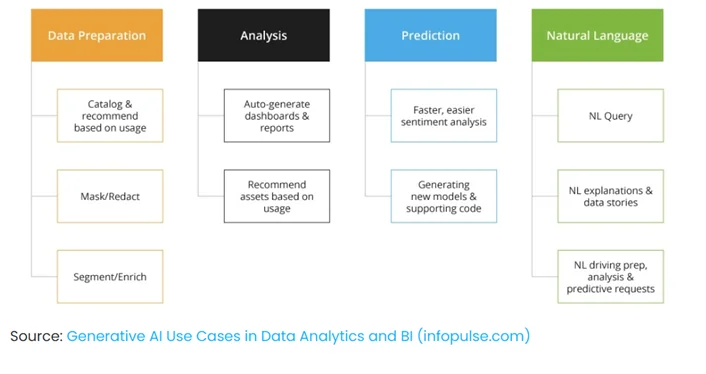
If you’re looking for consulting expertise in Power BI, continue reading to learn how Power BI can make your job easier and why hiring Power BI consultants is wise: The Value of Consulting Expertise in Power BI Implementations.
Conclusion
As AI continues to shape the future of business intelligence, Power BI AI capabilities are leading the way in transforming how organizations analyze and act on their data. With vast amounts of data flowing through every department, having a tool like Power BI that can quickly turn raw information into actionable insights is more critical than ever. By leveraging its advanced AI features, businesses can streamline their decision-making processes, save valuable time, and uncover opportunities that might otherwise go unnoticed—all without the heavy lifting.
Let’s Take the Next Step Toward Smarter Decision-making Together!
Your data is one of your most valuable assets, and with Power BI’s AI features, you can truly connect its potential to drive meaningful results. Whether it's detecting anomalies or simplifying complex queries, Power BI is equipped to turn your data into powerful insights. Our team of experienced Power BI consultants is ready to give you a personalized demo.
Request a DemoExplore Recent Blog Posts


