JMeter Plugins:
JMeter is an opensource powerful tool for load testing with features and capabilities that can be enhanced by adding plugins. JMeter plugins are software applications used to enhance the functionality of JMeter. The tool contains a “JMeter Plugins Manager” to install, update and uninstall plugins for the user, making the process user-friendly. Hence, by using JMeter, any attentive group can develop additions that will extend its capabilities and insert functions.
In this blog post, we will go over the installation and working of the Graph Generator Plugin. We will also observe, how it adds value to JMeter functionality.
Learn more about our QA Services
Graph Generator Plugin:
This plugin provides the load testing results in graphical form, enabling users to analyze the success ratio of Performance Testing.
Generate Images for Test Results:
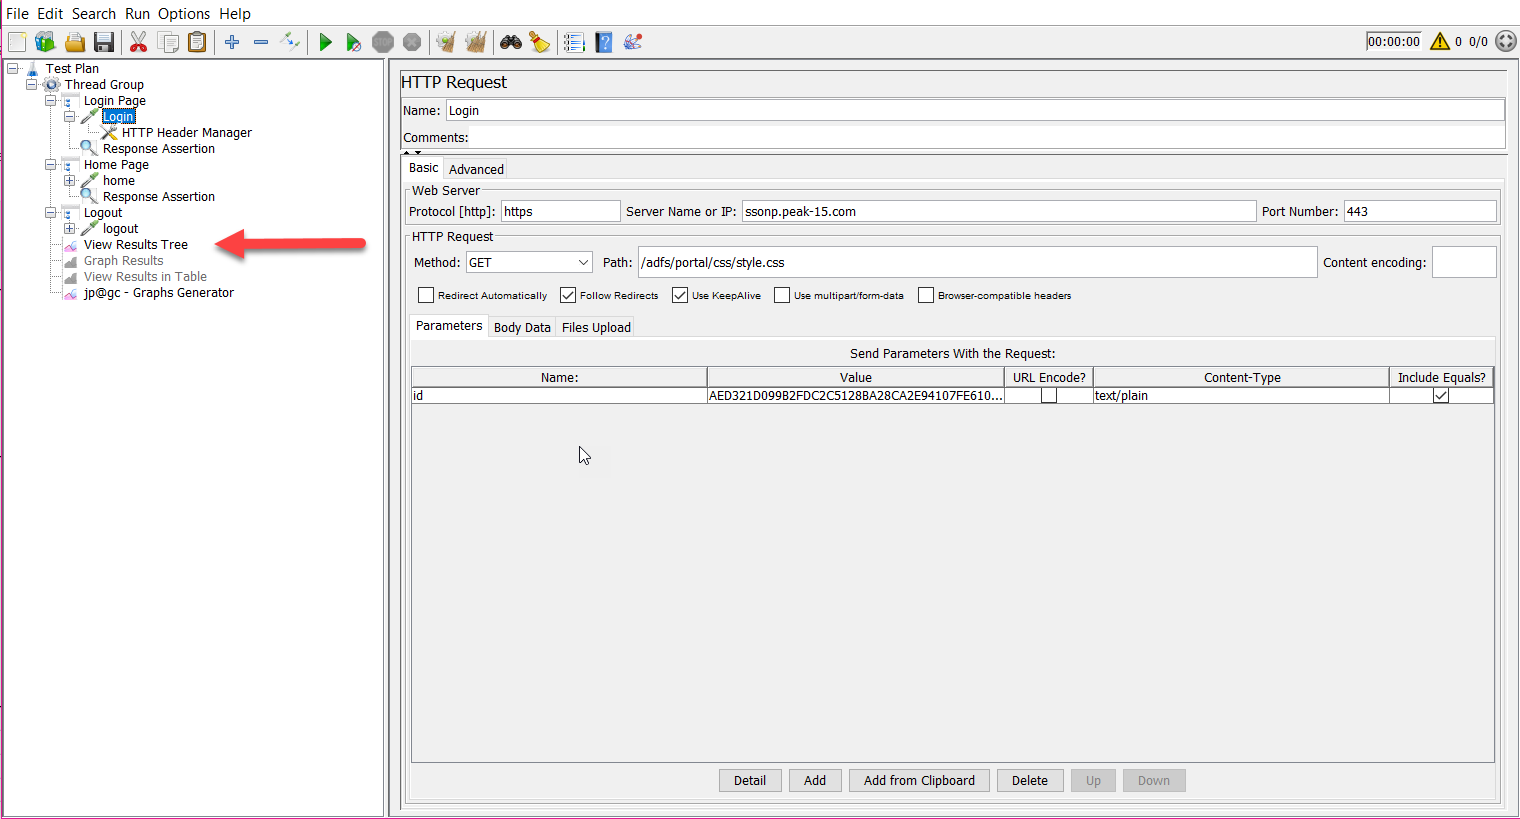
After the configuration of the View Results Tree Listener, the test results will be flushed into the configuration folder. Please note that if the View Results Tree Listener is not configured, the Graphs Generator Listener will not work.
Steps to install JMeter Plugins:
Step 1: Download Graph Generator Plugin
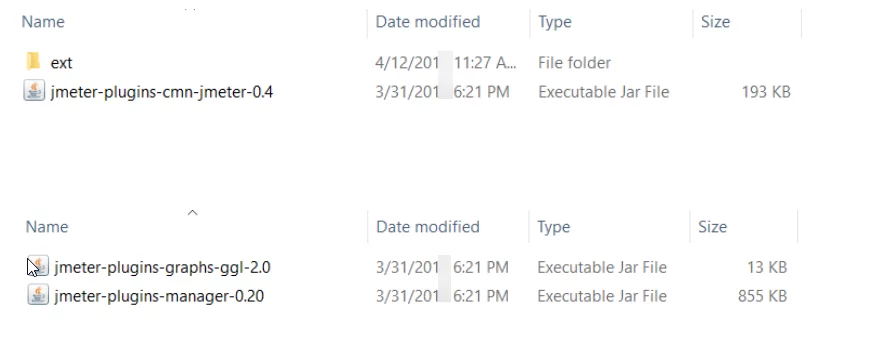
When you download the Graph Generator Plugin from the Google engine, it will download a .RAR file. Extract .RAR file to the same folder where JMeter is downloaded. The .RAR file must contain LIB files as well as EXT files, as shown in the image below:
Step 2: Plugin Jar files to JMeter
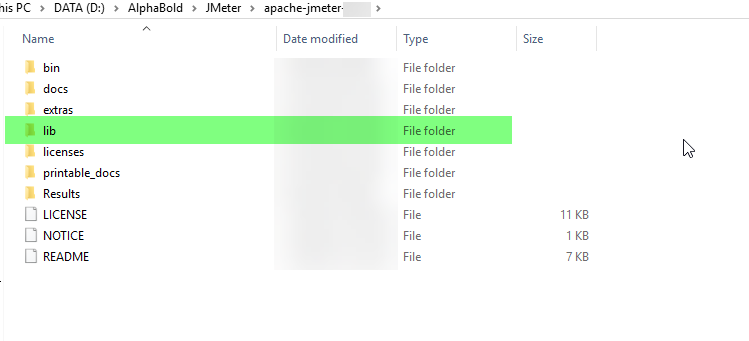
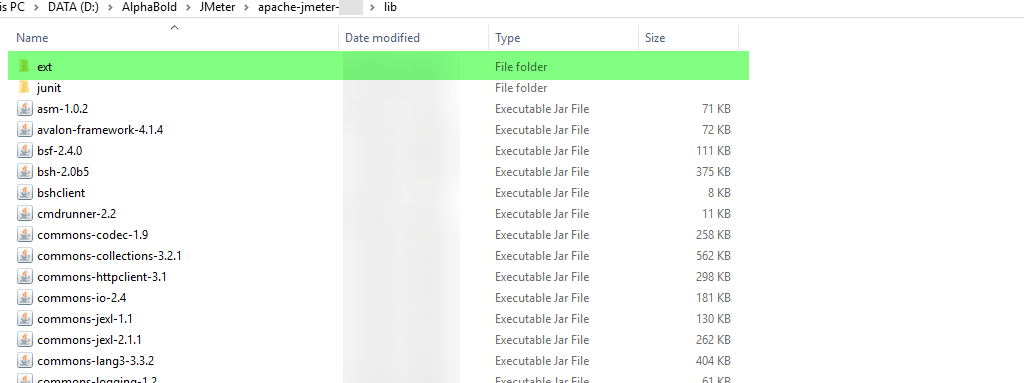
Place the LIB Executable file to JMeter’s Lib folder and Ext executable files to the JMeter’s Ext folder. Once it is installed, JMeter will update the plugin automatically, as shown in the image below:
Step 3: Display graph Generator Listener
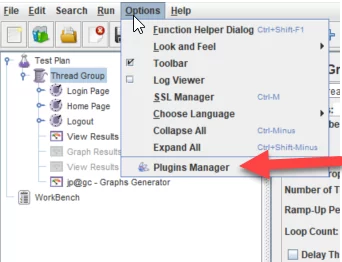
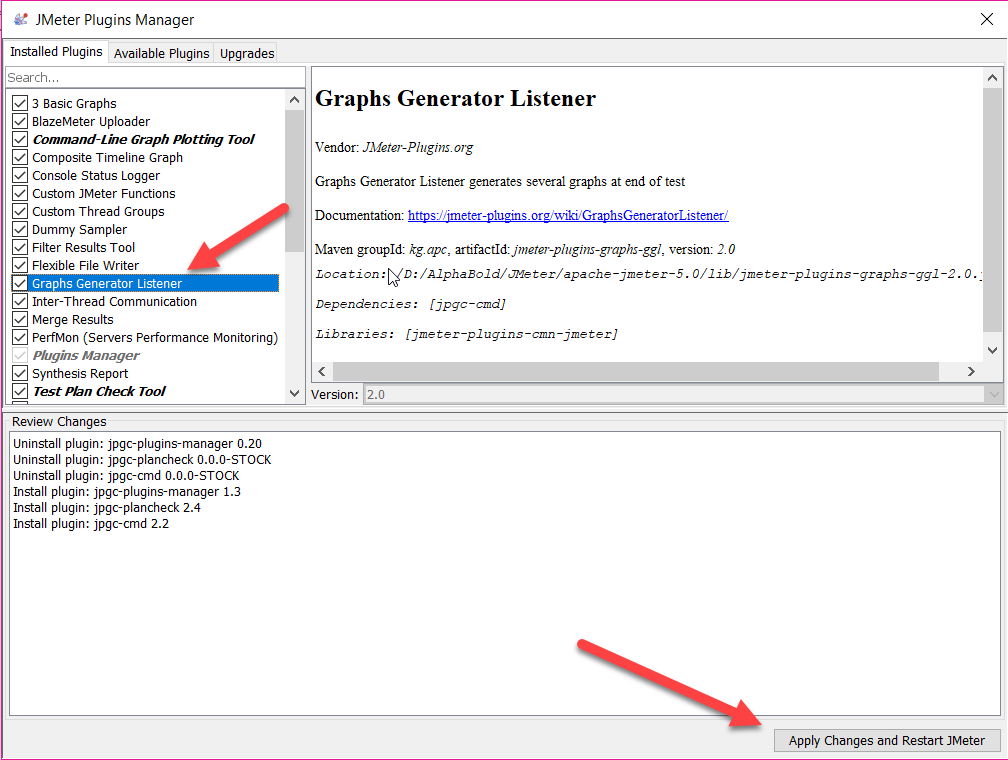
After restarting, the Graph Generator will be displayed in the JMeter Plugins Manager. Now check Graph Generator Listener, press Apply Changes and restart the JMeter button. This step will restart the JMeter to display the Graph Generator Listener as shown below:
Learn our QA Services
Graph Generator Working:
The Graph Generator’s operations depend on the Test Script Recorder, View Result Tree and Graph Generator. This operation will stop working if the sequence of the steps is compromised.
Step 1: Test script recorder:
The next step requires us to record a test script for the application on which the load test will run. If you do not know how to run a test script, refer to our previous blog “Improving Poor Web Performance using JMeter”.
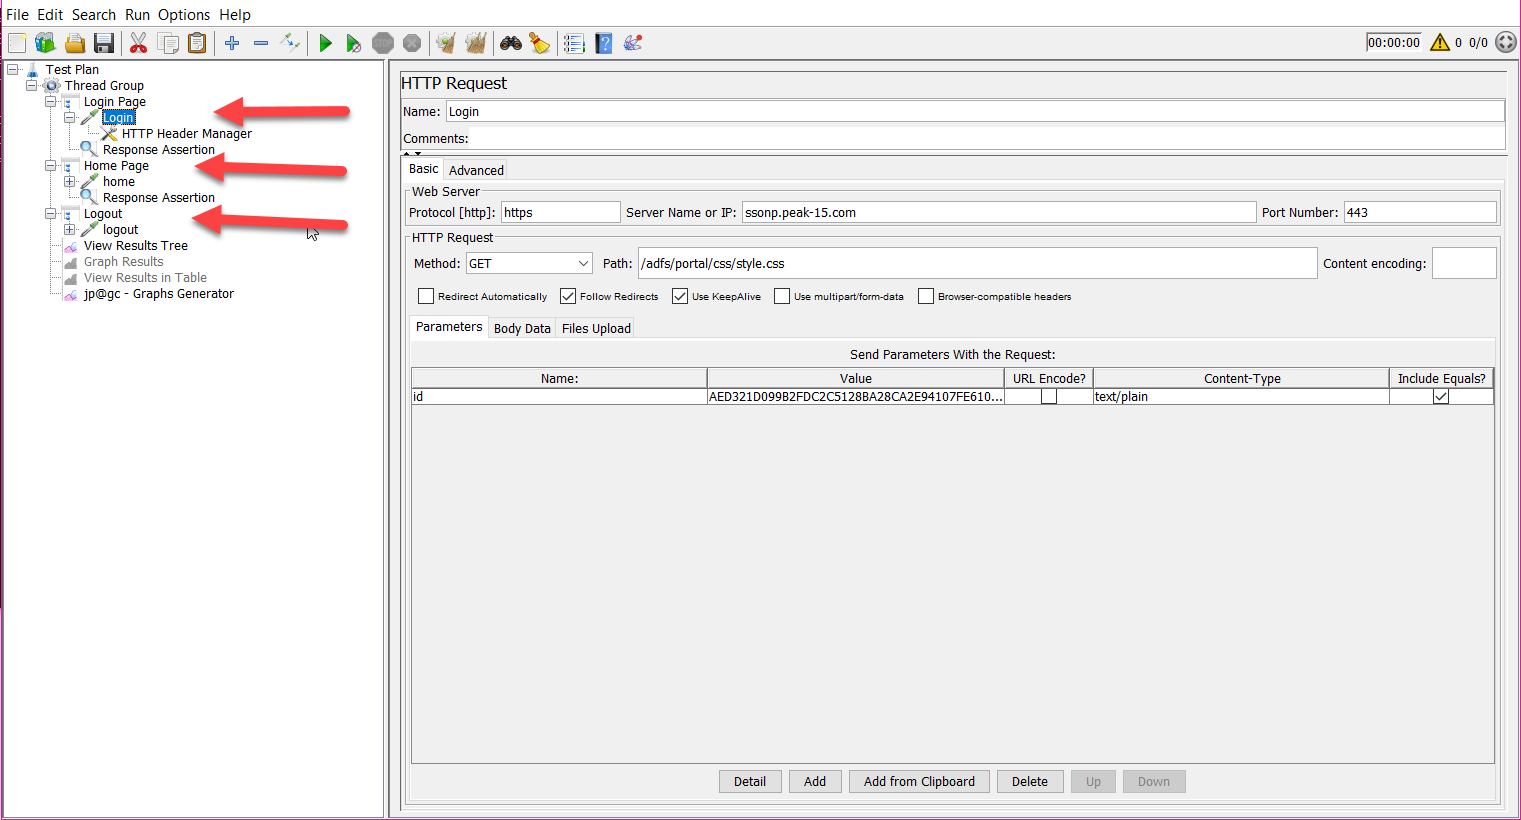
After recording all the steps, the script needs to be copied in the thread group as shown below:
Step 2: View result tree:
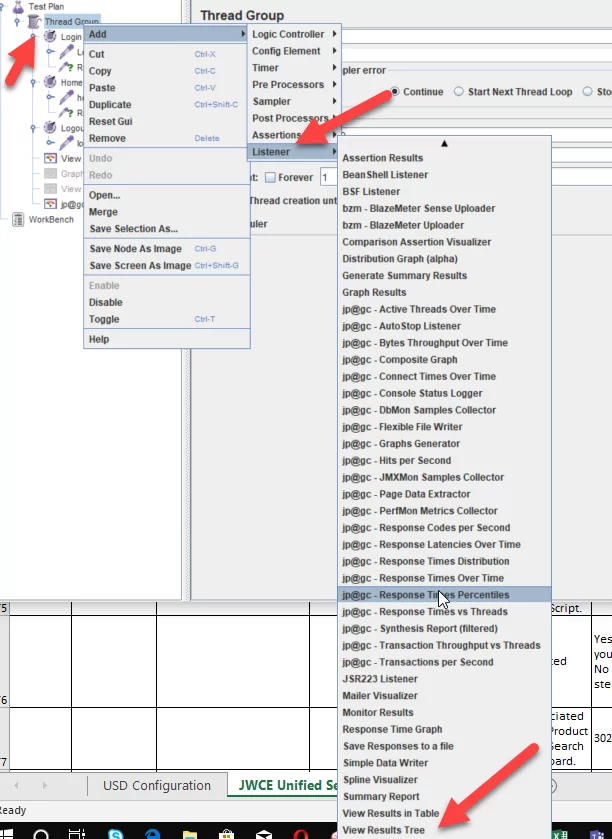
After that, we need to add Listener in Thread Group, which can be added by right-clicking on “Thread Group”. Select “Add”, then select “Listener” from the dropdown list and click on View result tree. It will appear under the Thread Group as shown below:
The file name will be shown when you click on View Result Tree. Click on the browser and add the path where the user wants to create a CSV result file. Add file name at the end of the path with the extension “.CSV” as shown below:
Step 3: Graphs Generator:
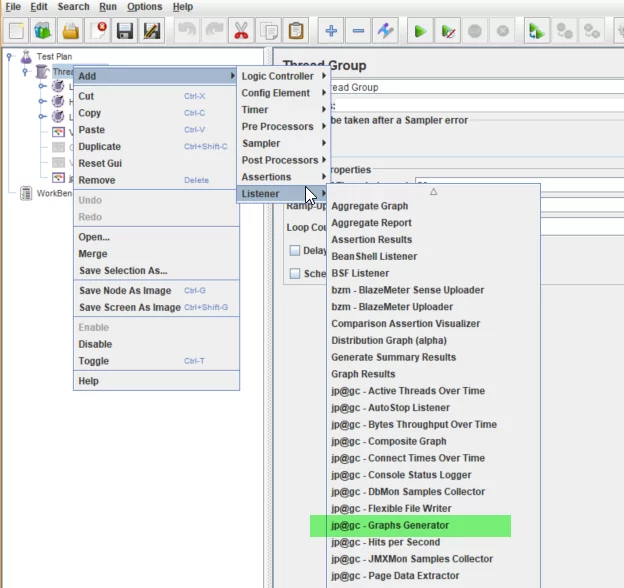
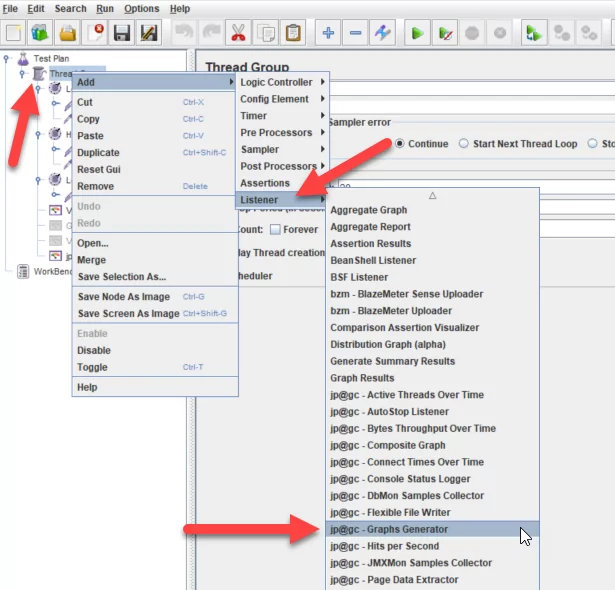
In the end, you need to add the listener of Graph Generator in the thread group, which can be added by a right-click on the “Thread Group” and then selecting “Add”. Select Listener from the the dropdown list and then click on Graphs Generator.
By clicking on the Graphs Generator, the user can see the output folder, JMeter results file, export Mode and File Prefix in the Output Configuration grid.
JMeter Result file: Paste the same path in “JMeter Results file” field which was given to View Results Tree’s “filename” field.
Export Mode: It contains three values in the dropdown; PNG, CSV and Both. If the user wants to extract the results only in PNG format, then he/she can select PNG. If only CSV results are required, then select CSV and if both outcomes are required, then select both from the dropdown.
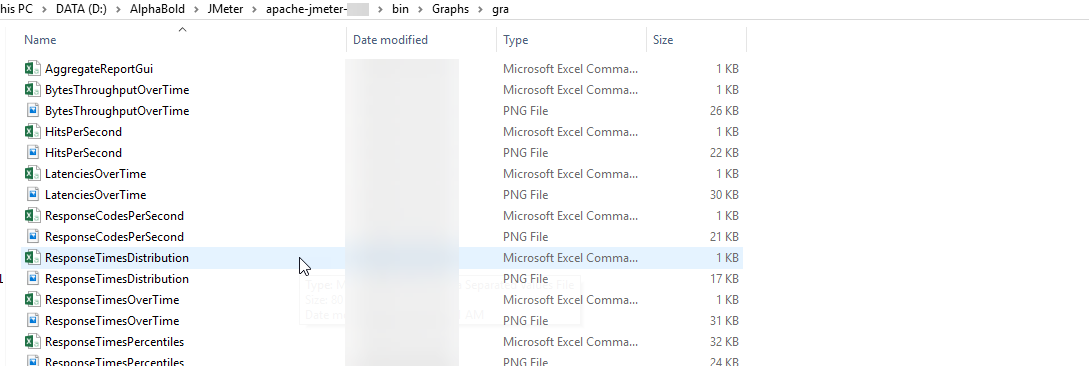
Output Folder: Output folder redirects to the desired folder that contains all the CSV and PNG files.
The graphs configuration grid contains twelve fields, but we will mention three of the most important fields.
Graph width in pixels: It is a numeric field where Graph Generator will generate results with the same width of PNG files, that are typed in the field.
Graph height in pixels: It is a numeric field where Graph Generator will generate results with same height of PNG files, that is typed in the field.
Granulation time for samples: Graphs will be finalized with this field time’s execution. Time is calculated in milliseconds.
Conclusion:
Hopefully, the above-mentioned steps will help you in creating graphs with the Graph Generator plugin and assist you in using JMeter with ease, allowing you to perform thorough testing for all your applications. If you have any question or queries, do not hesitate to reach out to us!







Well written. Easy to comprehend also
Well written. Perfect to understand