In this article, I will talk about a tool that is very useful to NetSuite Administrators, especially if their NetSuite instance contains a lot of customizations.
Application Performance Management (APM) is a SuiteApp that provides a summary or detailed view into NetSuite customizations, record / transaction processing times, saved search performance and much more. By mastering this tool you will be able to improve NetSuite’s UI performance and you will also be able to assist users who are experiencing NetSuite performance issues.
- I will first walk you through the installation process
- Next, I will explain how to configure your Performance Dashboard
- Lastly, I will briefly cover main script monitoring tools
Installation
- Go to Customization > SuiteBundler > Search & Install Bundles.
- In the Keywords field, enter the bundle ID or name for the APM application
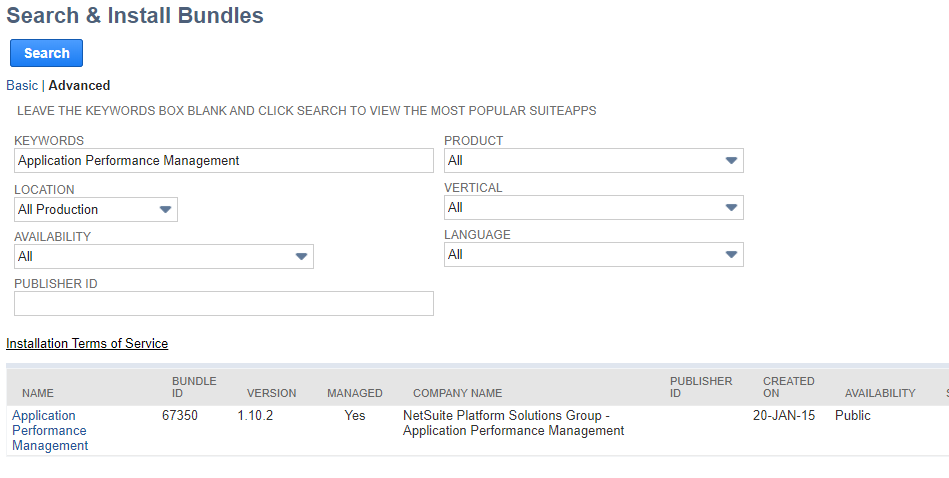
- Click Search, on the search results tab click on the APM link.
- On the Bundle Details page, click Install.
- On the Preview Bundles page, click Install Bundle. When the installation is completed, log out of the system and log back in.
Configuration
Next step is to configure the dashboard and the APM system to report on transaction types or records that are being heavily used or accessed in the system. Should you need additional information related to the steps outlined below, don’t hesitate to email us at support@alphabold.com.
Performance Dashboard
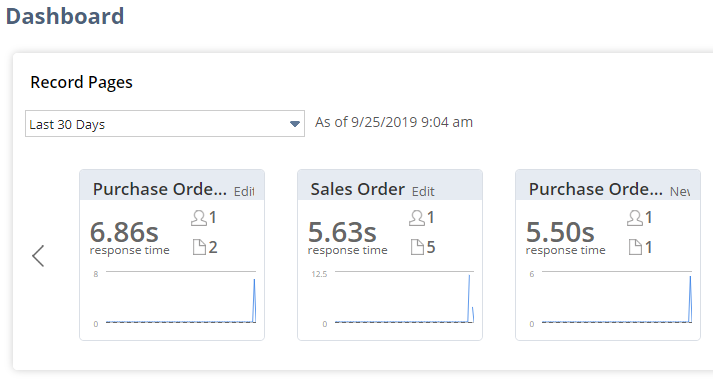
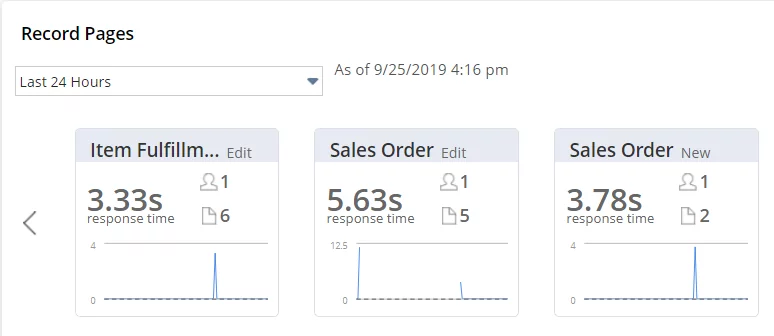
This is the place where you will identify and troubleshoot system performance. Visual clickable indicators will alert you of any issues in the system.
- To get to the performance Dashboard go here (Administrator):
Customization > Performance > Dashboard
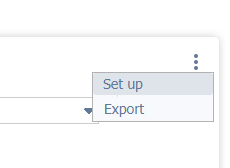
- Next, hover over the top-right corner of the slider. Click on ‘Set up’
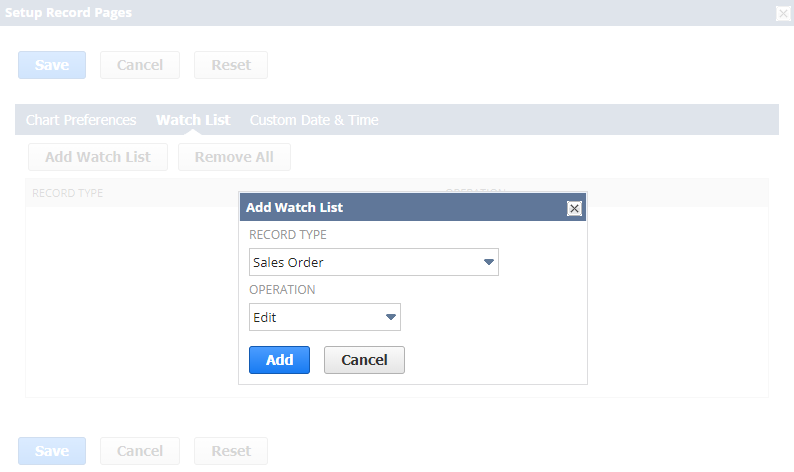
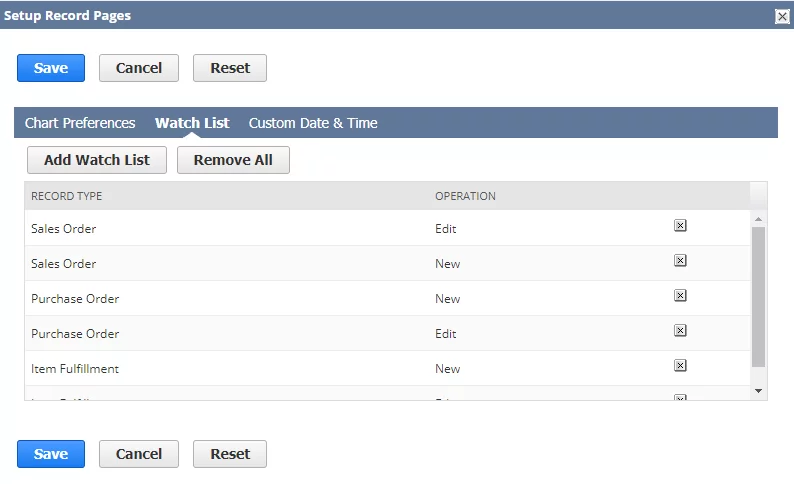
- In the first tab you can set Chart Preferences, my suggestion is to use ‘Show Watchlist Only’ option in the ‘Record Tiles’ field. I feel that ‘Show All Record Option’ is overwhelming when you start testing and using this tool.
- Click [Save] button to refresh the Dashboard
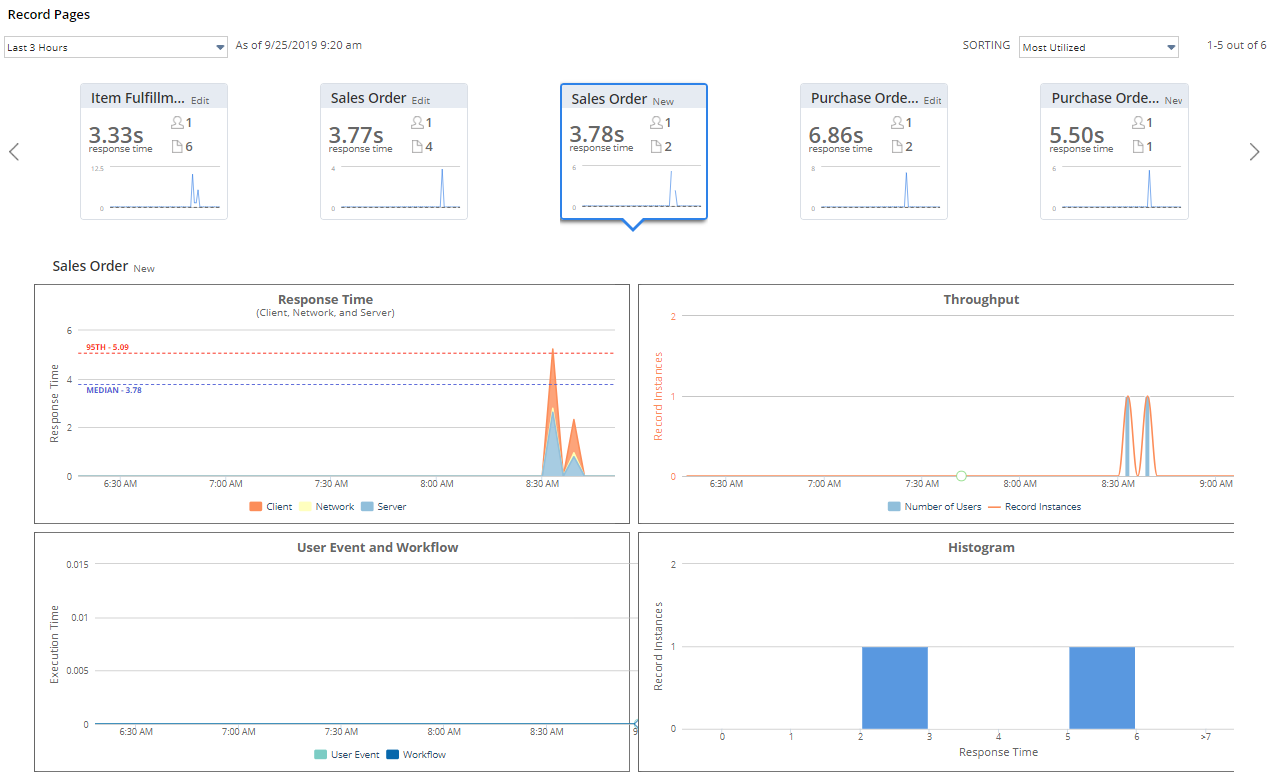
- Let’s click on any of the tiles.
The four charts that appear represent:
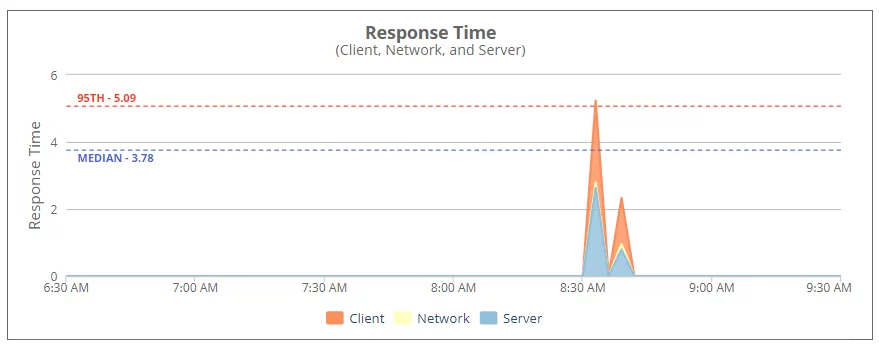
A. Response Time Graph
For this record type, the tool tracks the median response time over time. The graph will show the total request speed and assess its impact on end users.
Each color represents the portion of time used by the client (user’s machine), the network (of the user) and the server (NetSuite’s data center).
In this case our median is 3.78 seconds. We can also see the server response time represent 50% of the total response time.
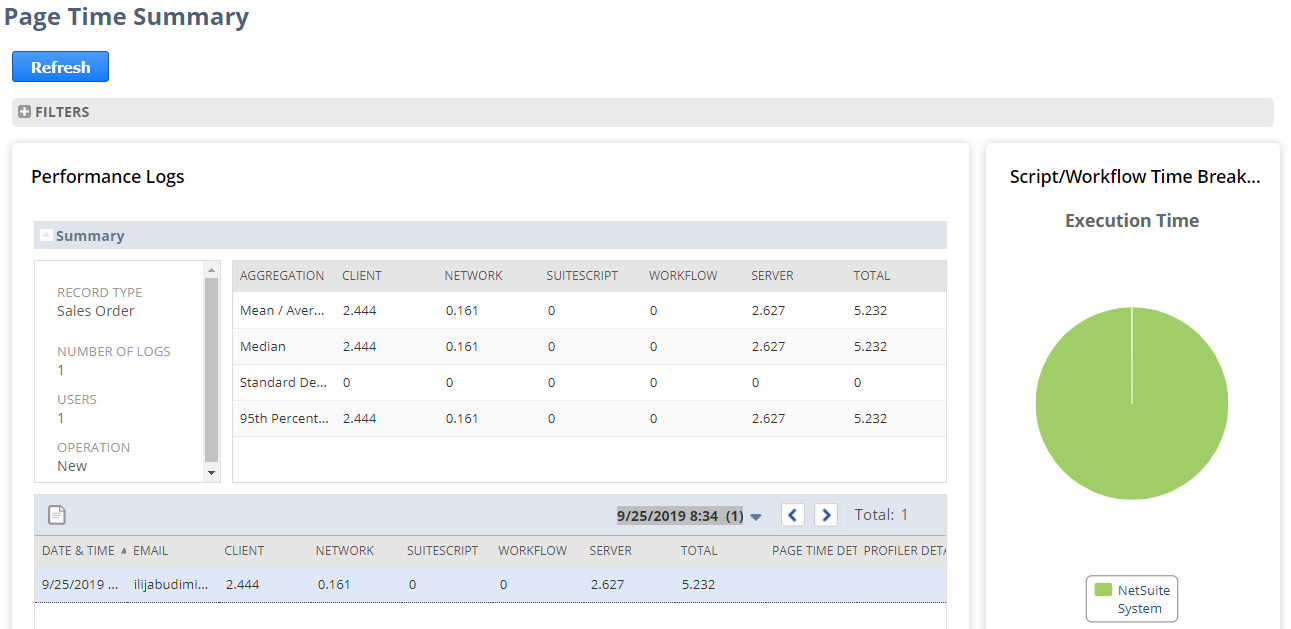
To get further detail you can click on any point on the graph. The following page will pop-up with additional detail.
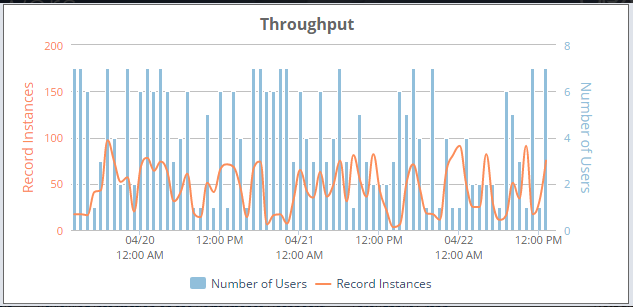
B. Throughput
You can use this graph to identify period of heavy usage. This will help you offload traffic to periods outside of peak times / hours.
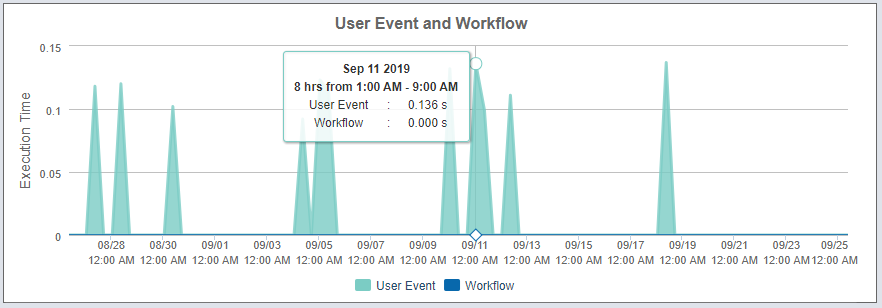
C. User Event and Workflow Graph
Scripts can add considerable time to the total record response time. This graph is designed to assist you in identifying the impact of the customizations in your system and possible performance issues.
When you click on any point on the graph (green area) you will see performance logs.
Permissions Configuration
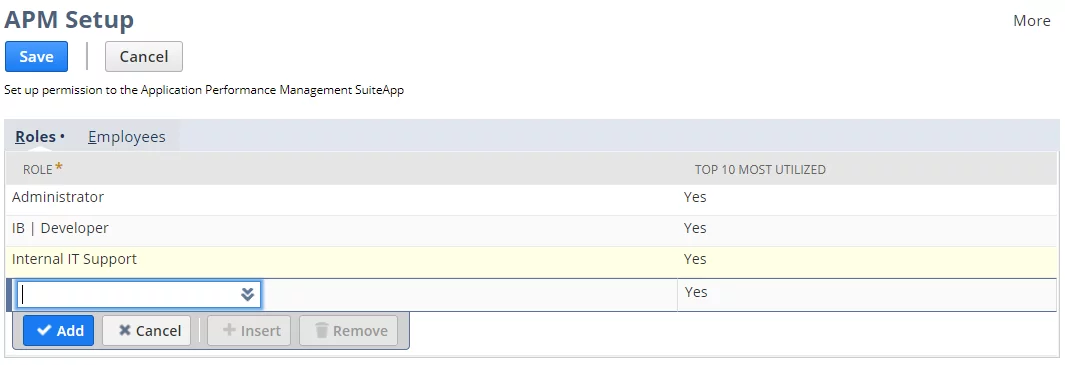
The administrator can adjust which roles are able to see the APM Dashboard. This can be configured here: Customization > Performance > APM Setup
The Top 10 Most Utilized column / checkbox can be checked to provide access to top 10 utilized tiles on the performance dashboard.
Script / Customization Monitors
These tools / screens provide both detailed and summary view and track the performance of your scripts, workflows and integrations. Below, I will talk about the most important screens that will allow you to monitor the execution of your SuiteScript scripts.
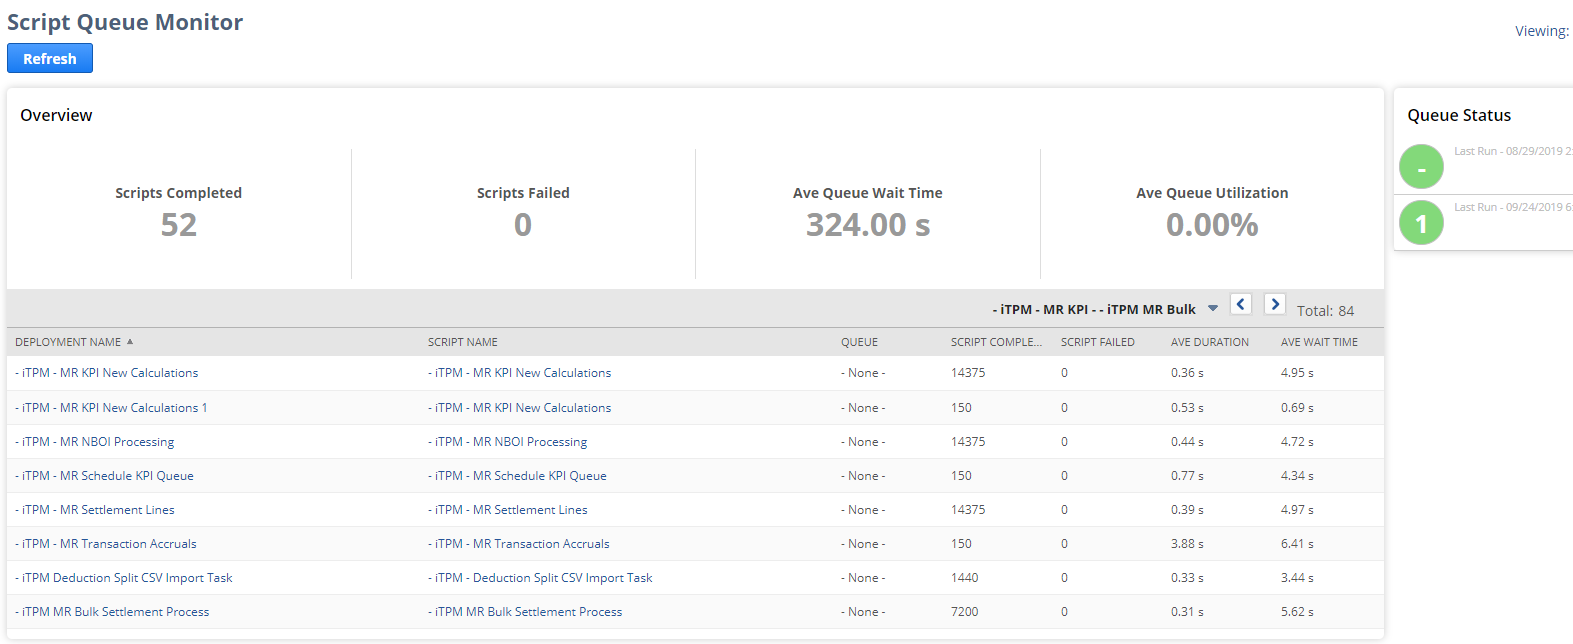
Script Queue Monitor
Go to Customization > Performance > Script Queue Monitor
This interface lists all scheduled and map/reduce scripts. Here, the administrator can review the script executions and identify statuses and potential failures.
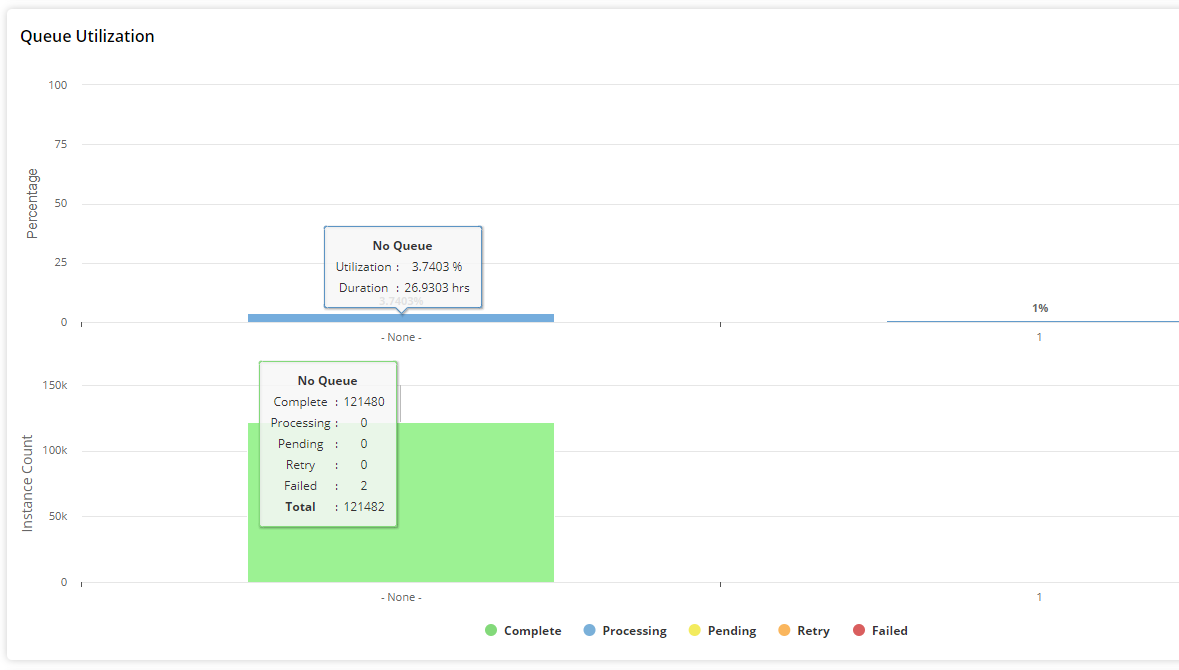
In the next chart (Queue Utilization) you can review the script execution in detail.
- Percentage Section – Shows the percentage of utilization of the script queue (processors in the system’s processor pool)
- Instance Count Section – Shows the number of script instances and their statuses
If you hover over each bar, you will be able to see additional execution-related details.
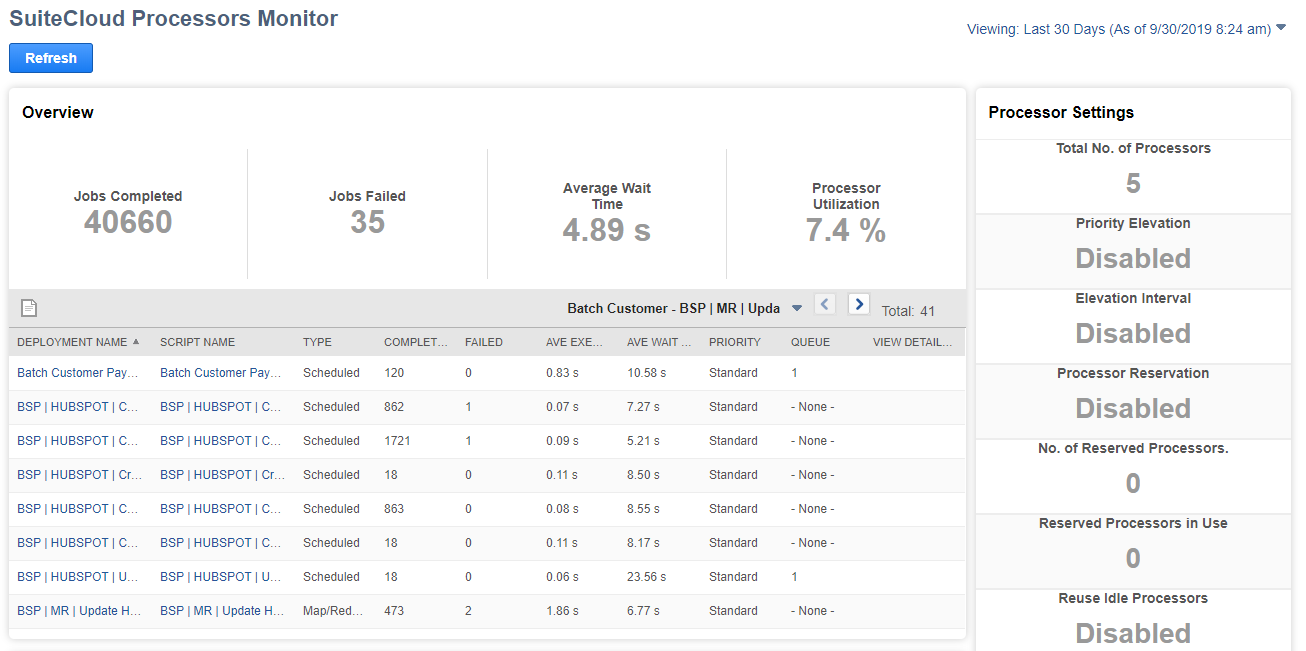
SuiteCloud Processors Monitor
Navigate to Customization > Performance > SuiteCloud Processors Monitor
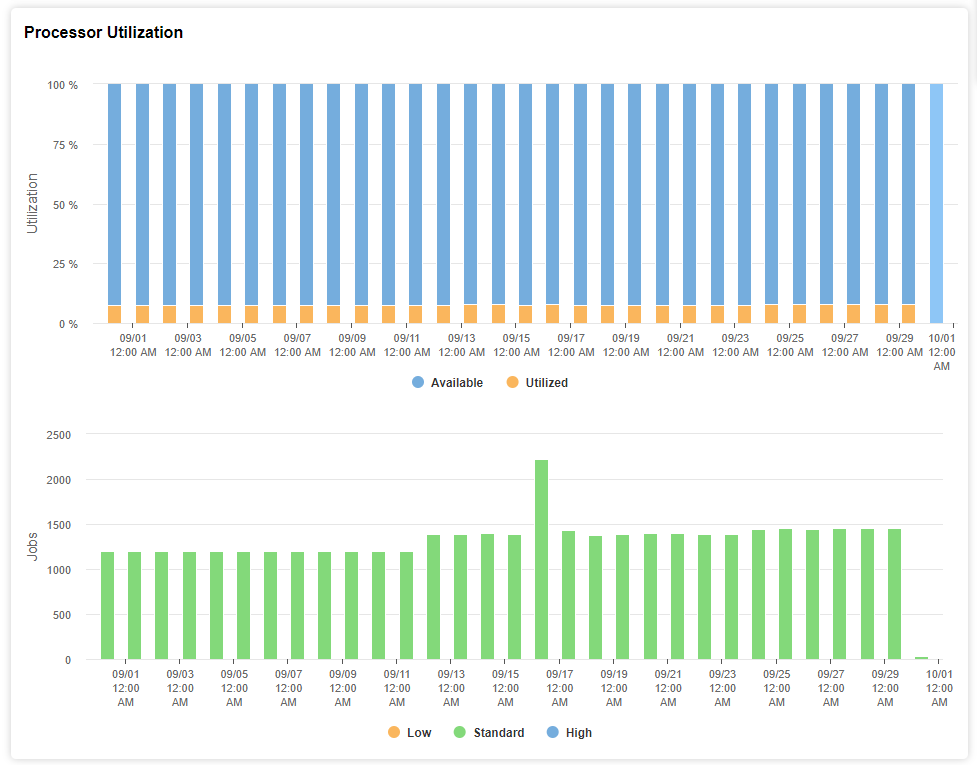
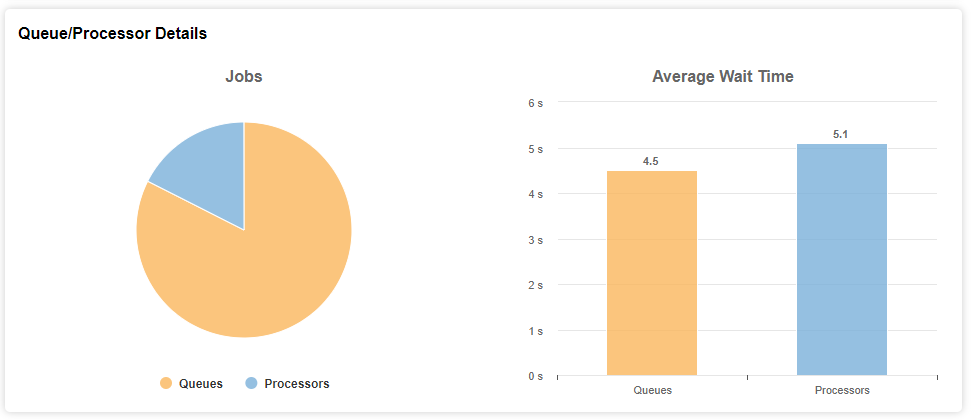
SuiteCloud Processors is the system used to process scheduled scripts and map/reduce scripts.
Before SuiteCloud Processors were added, the scheduled scripts were exclusively managed through scheduling queues. All of the scripts were submitted to the same queue and were executed on a FIFO (first in, first out) basis, based on the submission time stamp. The queue scheduling had several limitations and it did not provide automated load balancing and the way to prioritize certain jobs.
After SuiteCloud Processors were implemented, the system can now automatically determine the order in which jobs start. This is decided by the algorithms that consider user-define priority levels, submission time and preferences. This in turn increases the throughput, reduces wait time and lastly eliminates bottlenecks.
Terminology
| Term | Definition |
| Job | A job is a piece of work submitted to SuiteCloud Processors for processing. Each job is executed by a single processor. |
| Priority | A priority is a property of a job. The priority of submitted jobs determines the order in which the scheduler sends the jobs to the processor pool. Priorities are set on the deployment record or from the SuiteCloud Processors – Priority Settings Page. |
| Processor | A processor is a virtual unit of processing power that executes a job. It is not distinguished as an individual physical entity, but as a single processing thread. |
| Processor Pool | The processor pool represents the number of processors available to a specific account. For accounts without SuiteCloud Plus, the processor pool contains one processor. For accounts with SuiteCloud Plus, the processor pool contains multiple processors. For additional information, see SuiteCloud Plus Settings. |
| Queue | With SuiteCloud Processors, a queue is no longer a separate processing mechanism. On scheduled script deployments, the Queue field remains to accommodate deployments that rely on the FIFO (first in, first out) order imposed by an individual queue. However, all jobs that use queues are actually processed by the same processor pool that handles the jobs that do not use queues. All jobs compete with each other using the same common processing algorithm. |
| Scheduler | The scheduler determines the order in which jobs are sent to the processor pool. The scheduler uses algorithms that are based on user-defined priority levels, submission time, and user-defined preferences. |
| Task | A task is a script instance that is submitted for processing. Each task is handled by one or more jobs. |
Source: https://netsuite.custhelp.com/app/answers/detail/a_id/66983
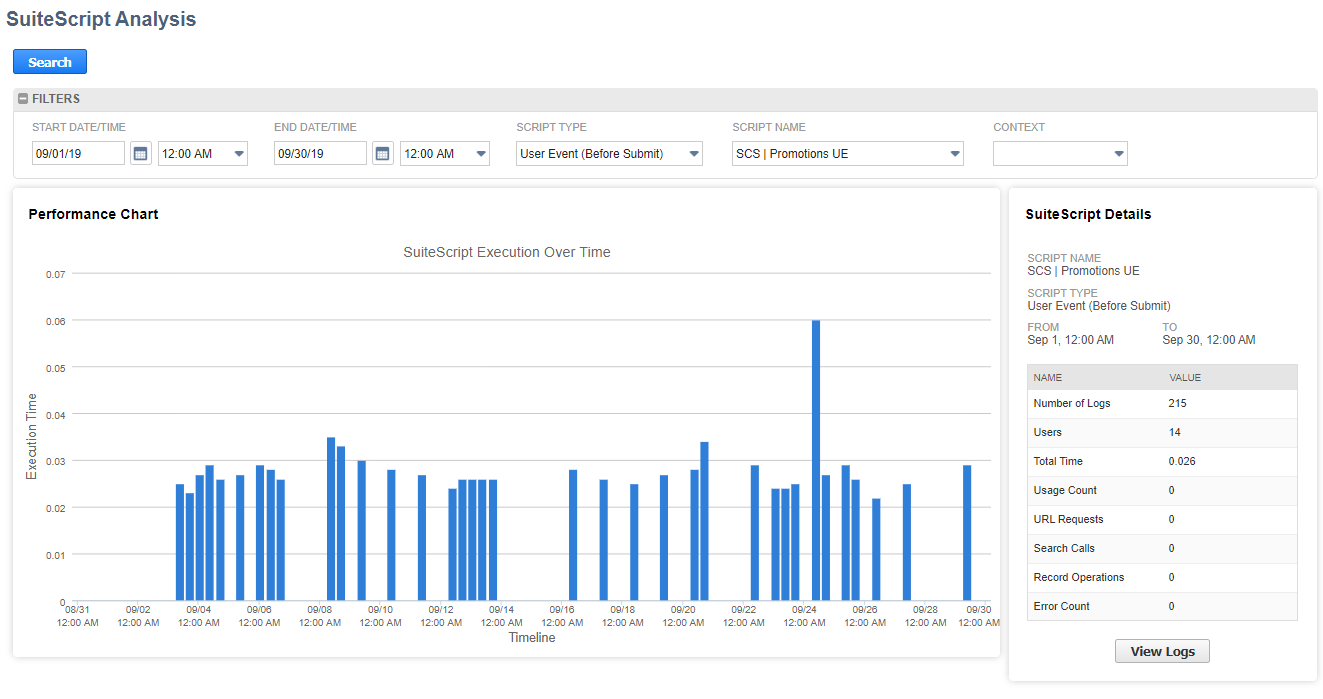
SuiteScript Analysis
Go to Customization > Performance > SuiteScript Analysis
On this screen, the administrators can review individual scripts (user event, scheduled, Suitelets, RESTlets, Client) and their execution within the user environment. It’s helpful when you deploy a script and you want to monitor its individual performance / speed of execution.
This was a brief overview of the APM tool in NetSuite. If you have any questions or if you feel you system is running slowly, feel free to reach out to us and we will be happy to assist you.
If you have any question or queries, do not hesitate to reach out to us!
Your AlphaBOLD team!

