Learn how to create a Dynamics 365 Dashboard for a quick visual representation to see your data that matters to you the most. It provides real-time insight and helps you identify items that need attention.
Dashboards are information management tools that enable users to visually track, evaluate, and view key performance indicators (KPI). It is an easy and simple way to access data in either a view form or a chart that you want to see daily from a single point of access.
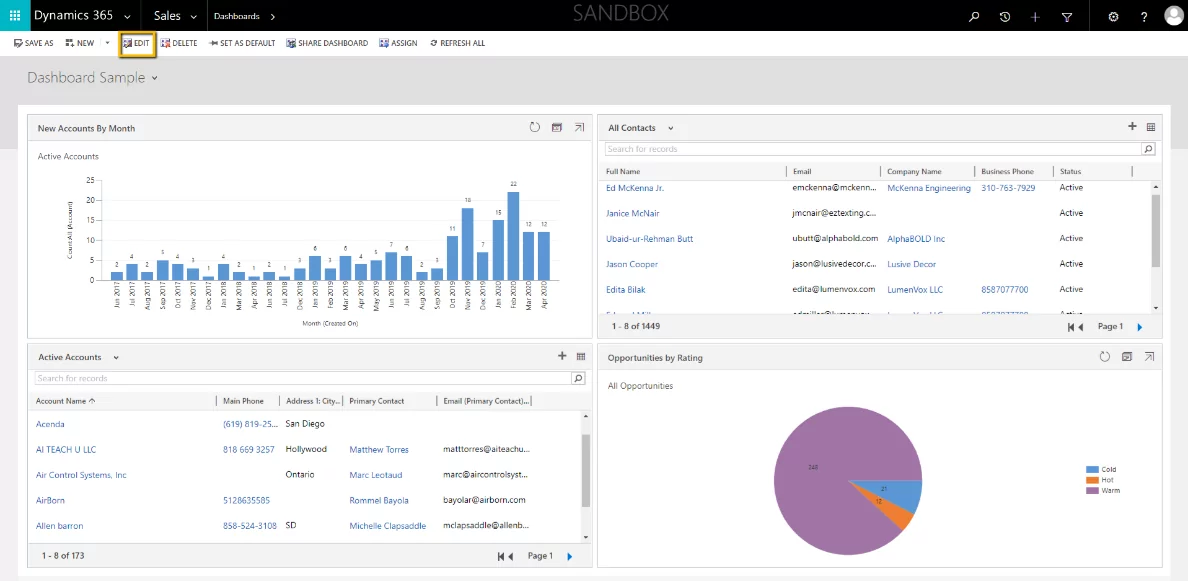
You can create dashboard systems for your business or your personal use to enjoy a highly visual, flexible, and intuitive overview of your affairs. Whether to monitor your daily work items, teams, or system functionality, dashboards are a one-stop-shop to review data at-a-glance. In this article, I will demonstrate how you can create a Personal Dashboard so that you can focus on what is important to you.
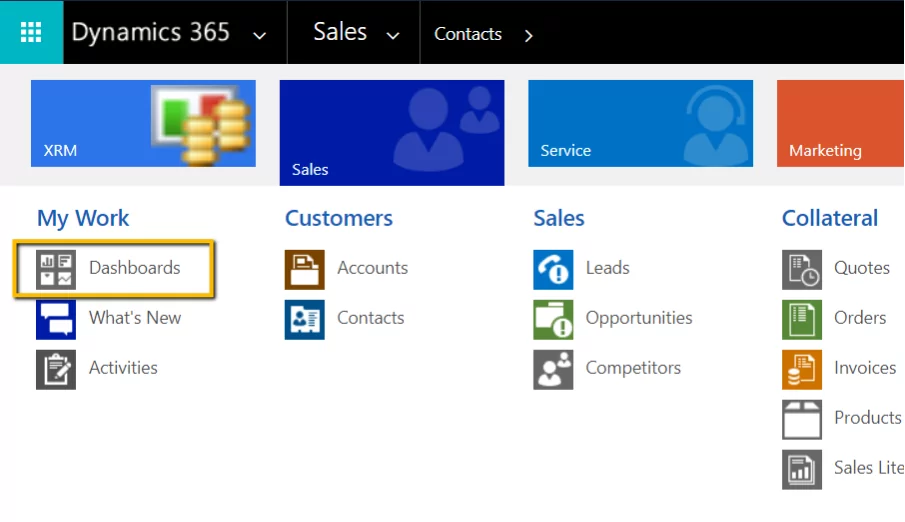
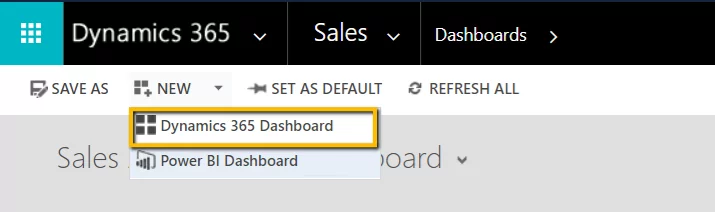
Head to the Navigation Bar and click on New and select Dynamics 365 Dashboard.
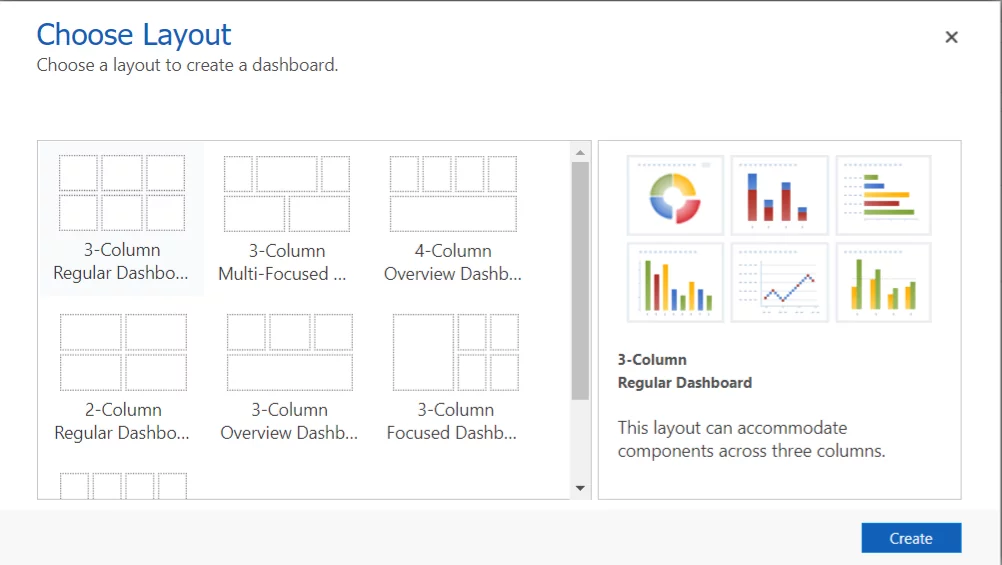
Choose Component Layout:
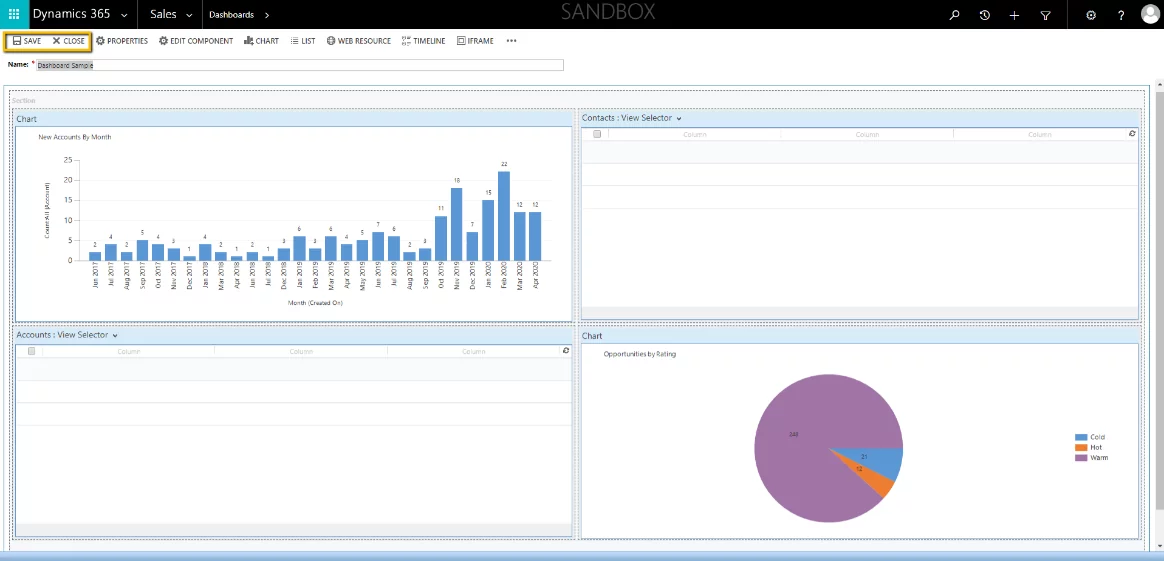
Select a layout and click create. The layout you choose is not permanent. You will be able to modify the elements later. For this example, we will go with the 2-Column Regular Dashboard.
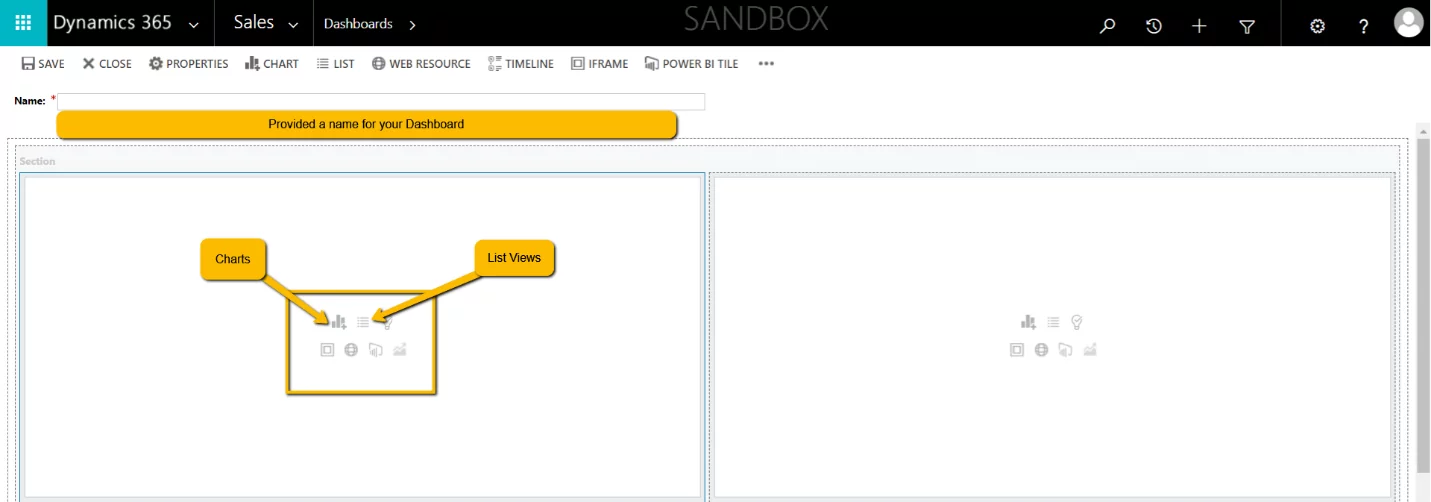
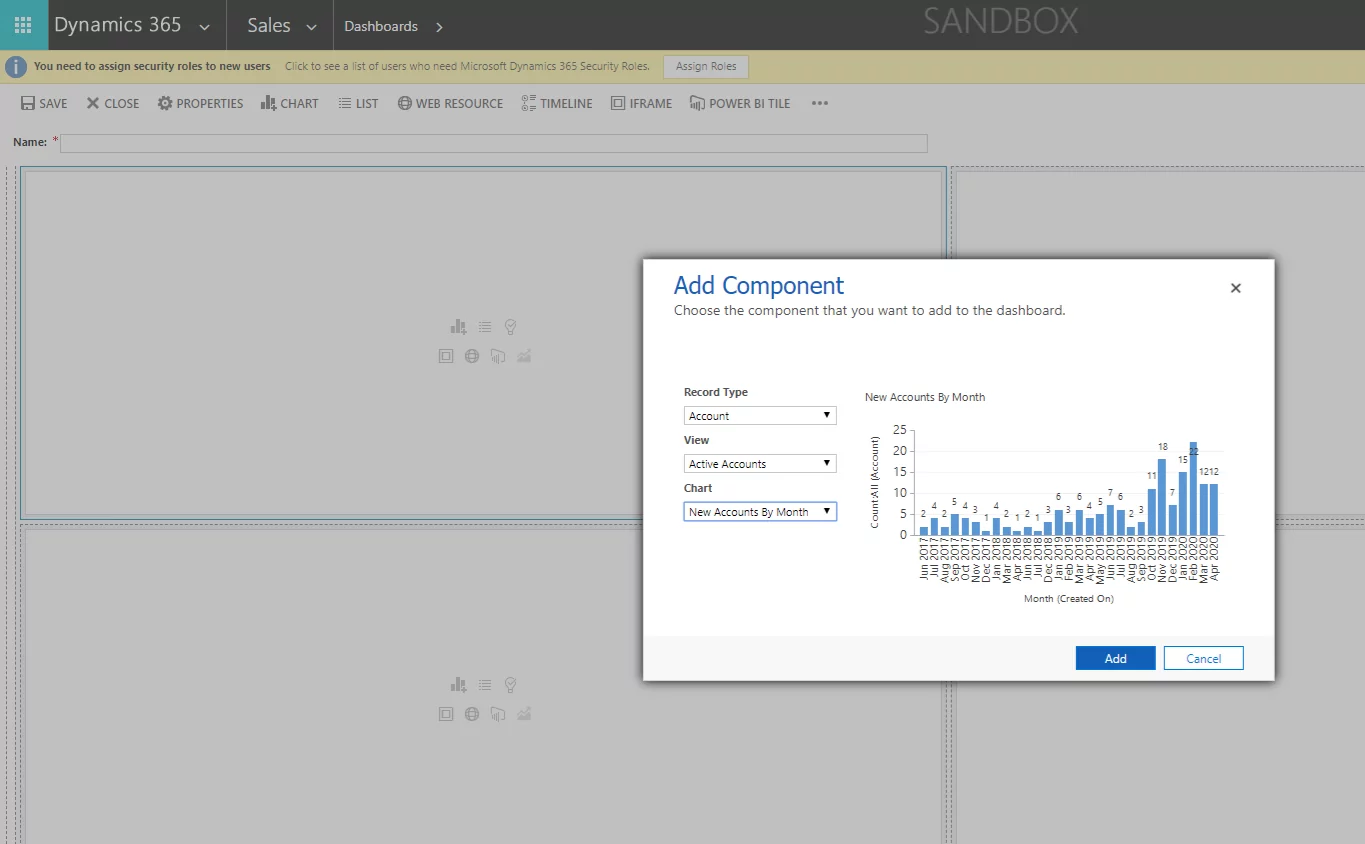
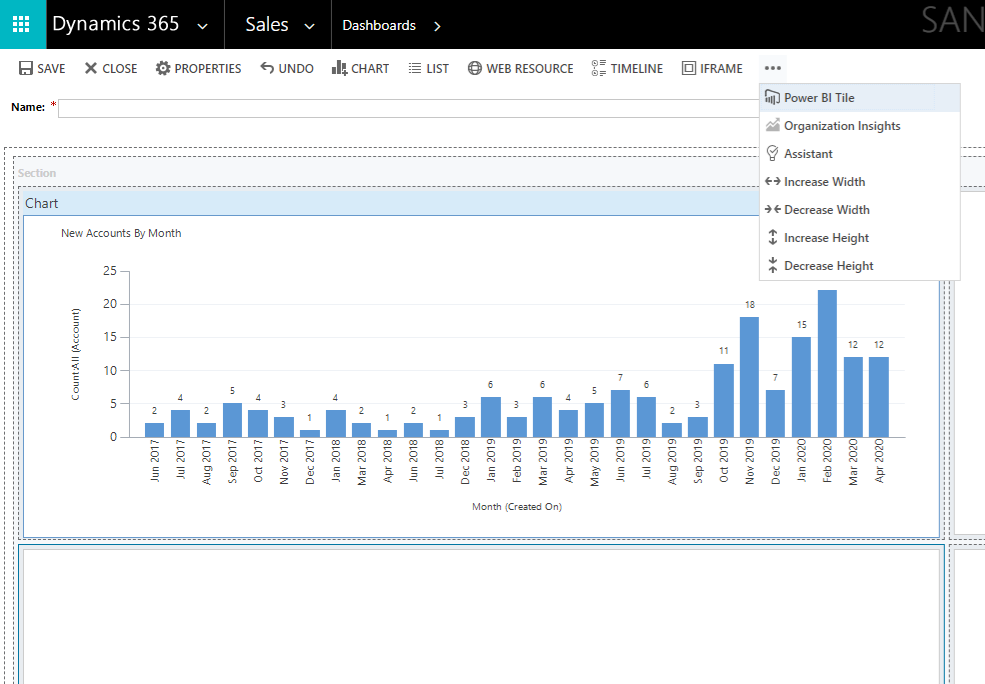
Within the Component, you can add a Chart, List view, Relationship Assistance, Iframe, Web Resources, Power BI, and Organizational Insight.
For now, we will just focus on adding Charts and List views. Click on the Charts icon, and do not forget to provide a name for your Dashboard.
There you go, folks! Here is how you can create a dashboard for personal use in just eight steps. If you have any questions or would like more information, please reach out to our AlphaBOLD team using the comment box below. We will get back to you ASAP.