Introduction
In this blog, we will discuss the issues we face during the debugging of a plugin in an Online environment of Dynamics 365 CRM. We will learn how to set up a Plugin Profiler and solve the problems related to debugging by identifying and tracking down the problems in the “logic” behind the plugins. Let’s begin, shall we?
Downloading CRM SDK V9.X:
For CRM connectivity, you need to download the Dynamics CRM SDK v9.x using the PowerShell command.
Read more about Dynamics SDK Batch Requests
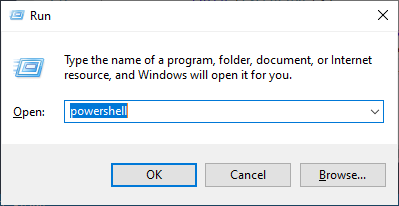
Open PowerShell using RUN (press Win key + R).
Elevate Your Dynamics CRM 365 with AlphaBOLD
Discover the full potential of your Dynamics CRM 365 Online with AlphaBOLD's consulting services. From debugging to optimization, our team is here to assist.
Request a DemoCreate a new folder with the name SDK_V9 on your C drive and change the directory in PowerShell using the following command: cd c:sdk_v9
Copy and paste the following command to download the SDK V9.0 in the folder.
$sourceNugetExe = https://dist.nuget.org/win-x86-commandline/latest/nuget.exe $targetNugetExe = “.nuget.exe” Remove-Item .Tools -Force -Recurse -ErrorAction Ignore Invoke-WebRequest $sourceNugetExe -OutFile $targetNugetExe Set-Alias nuget $targetNugetExe -Scope Global -Verbose ## Plugin Registration Tool ./nuget install Microsoft.CrmSdk.XrmTooling.PluginRegistrationTool -O .Tools md .ToolsPluginRegistration $prtFolder = Get-ChildItem ./Tools | Where-Object {$_.Name -match ‘Microsoft.CrmSdk.XrmTooling.PluginRegistrationTool.’} move .Tools$prtFoldertools*.*
.ToolsPluginRegistration Remove-Item .Tools$prtFolder -Force -Recurse ## CoreTools ./nuget install Microsoft.CrmSdk.CoreTools -O .Tools md .ToolsCoreTools $coreToolsFolder = Get-ChildItem ./Tools | Where-Object {$_.Name -match ‘Microsoft.CrmSdk.CoreTools.’} move .Tools$coreToolsFoldercontentbincoretools*.* .ToolsCoreTools Remove-Item .Tools$coreToolsFolder -Force -Recurse ## Configuration Migration ./nuget install Microsoft.CrmSdk.XrmTooling.ConfigurationMigration.Wpf -O .Tools md .ToolsConfigurationMigration $configMigFolder = Get-ChildItem ./Tools | Where-Object {$_.Name -match ‘Microsoft.CrmSdk.XrmTooling.ConfigurationMigration.Wpf.’} move .Tools$configMigFoldertools*.* .
ToolsConfigurationMigration Remove-Item .Tools$configMigFolder -Force -Recurse ## Package Deployer ./nuget install Microsoft.CrmSdk.XrmTooling.PackageDeployment.WPF -O .Tools md .ToolsPackageDeployment $pdFolder = Get-ChildItem ./Tools | Where-Object {$_.Name -match ‘Microsoft.CrmSdk.XrmTooling.PackageDeployment.Wpf.’} move .Tools$pdFoldertools*.* .ToolsPackageDeployment Remove-Item .Tools$pdFolder -Force -Recurse ## NuGet.exe Remove Remove-Item nuget.exe
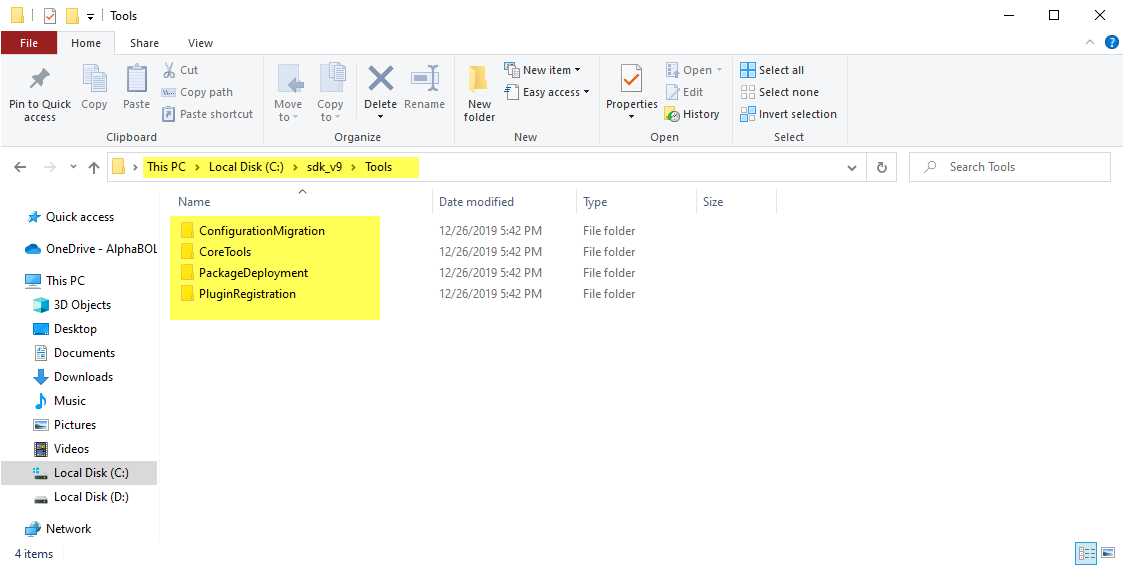
The tools will be downloaded to the folder.
Setting Up The Plugin Registration Tool:
Open the folder sdk_v9 and navigate to ToolsPluginRegistration
Open the PluginRegistration.exe and click on Create New Connection.
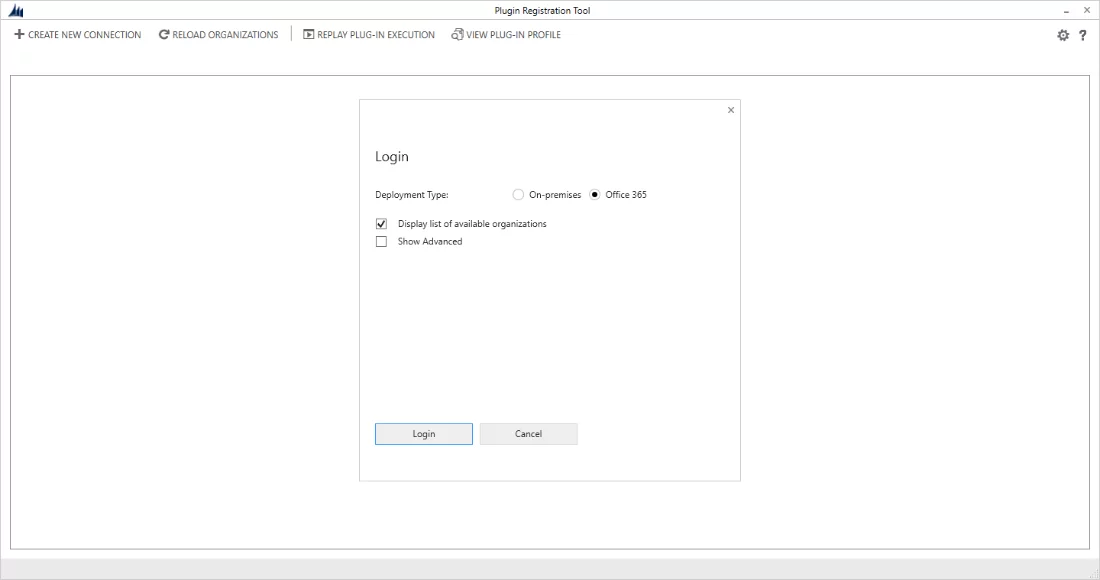
Provide the ORG details and credentials as shown in the image below:
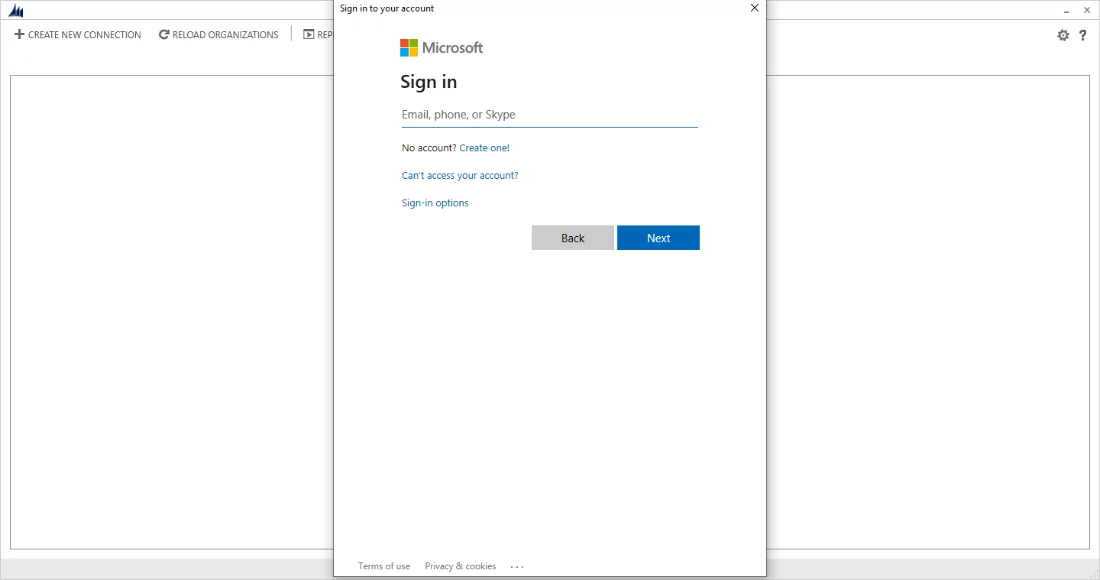
After you log in, it will ask for the instances of your Organization. Select the Organization which has the plugin that you are attempting to debug.
To begin the debugging process, you will need to install the Plugin profiler in the Organization. Click on Install Profiler from the ribbon of the Plugin Registration Tool to install the Plugin Profiler.
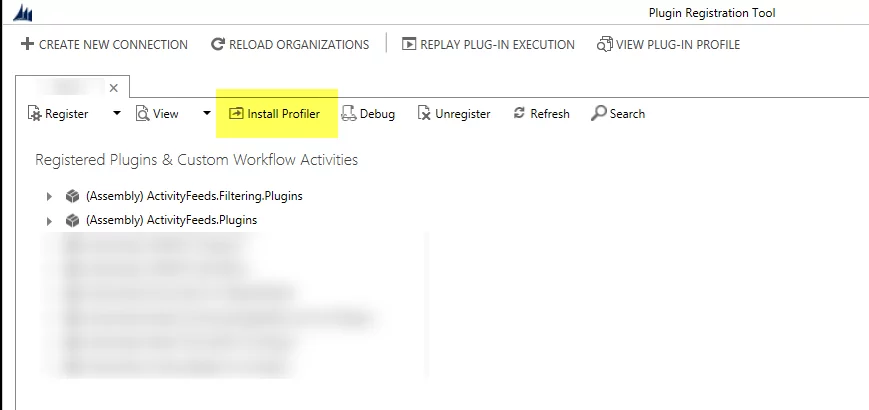
After the installation of the profiler is complete, a node will be added with the name “Plug-in Profiler“. It is highlighted in the image below:

A solution will also be added to the Dynamics CRM Instance as shown below, you will see it when you open the ORG:

Setting Up The Plugin To Debug:
The next step is to select the plugins that you want to debug. Navigate to the plugin registration tool, select your desired “Step” and then from the Ribbon menu click on “Start Profiling“.
For example:
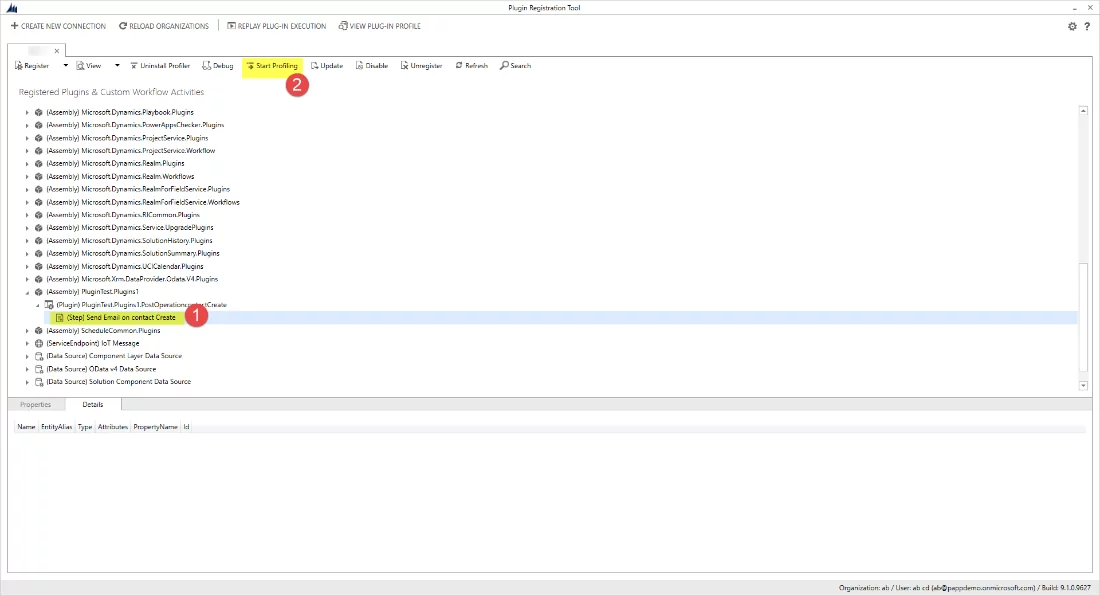
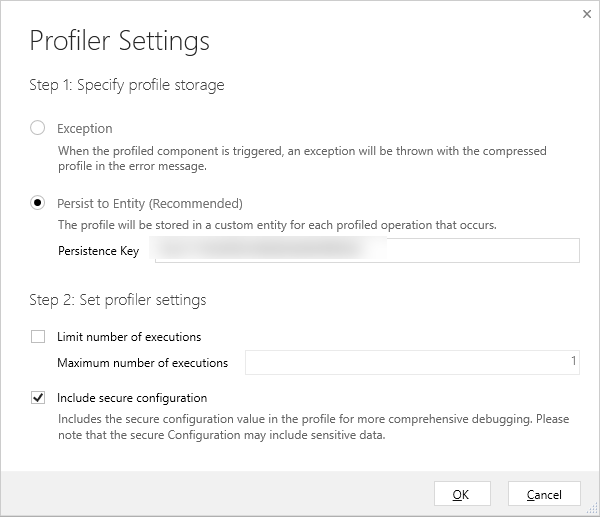
A dialogue box titled “Profiler Settings” will appear. Choose your Settings, click OK and continue. It’s better to go with the “Recommended Settings” option.
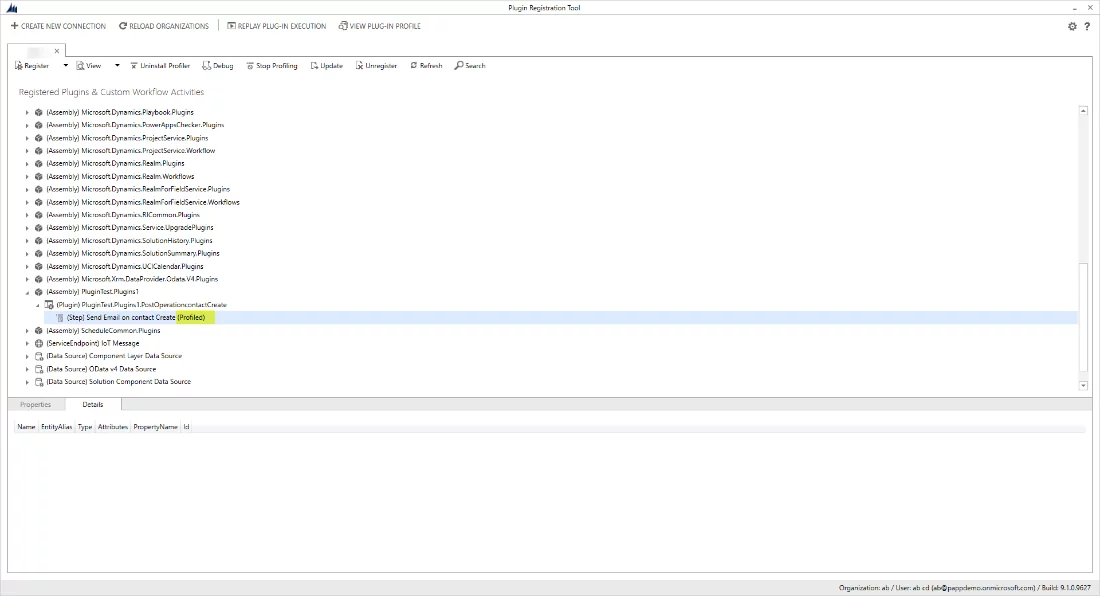
You will see an updated Step name on the Plugin Registration Tool after the Step has profiled. The word “Profiled” would appear at the end of the plugin step. Refer to the image below:
Important:
In the next step you need to trigger the plugin:
Exception: if you selected Exception in Profiler Settings, it will generate an exception and a log file when you perform the operation. Download and Save the file. You will need that later for further debugging.
Persist to Entity: if you selected Persist to Entity in Profiler Settings, it will generate a CRM Plugin Profile record with the serialized content. You can view it by redirecting to Setting>>>Plug-in Profiles.
Transforming Dynamics CRM 365 Challenges into Successes
Turn your Dynamics CRM 365 Online challenges into opportunities with AlphaBOLD. Our expert consulting services focus on innovative solutions and strategic support.
Request a DemoSetting Up Visual Studio:
Now open the Plugin Code in the Visual Studio solution and add a breakpoint to the debug plugin code. Usually, this is added to the Execute function of the Plugin.
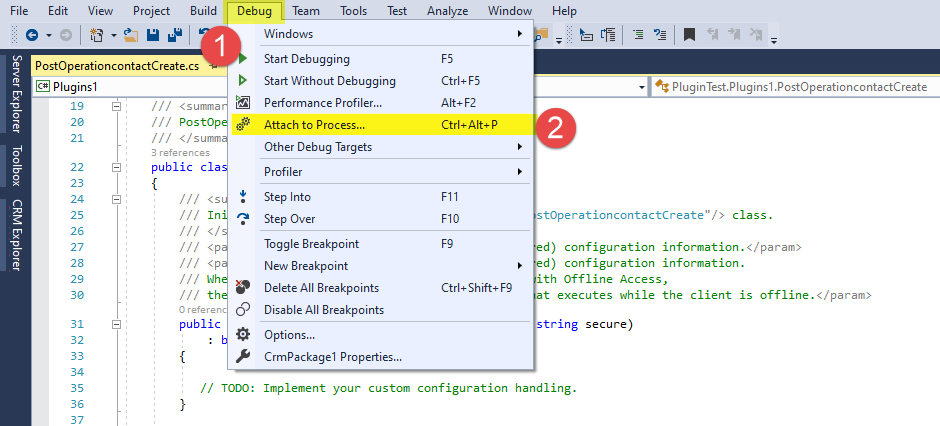
The next step is to attach the Plugin Registration tool with the Visual Studio. Navigate to “Debug” from the file menu, and then click on Attach to Process.
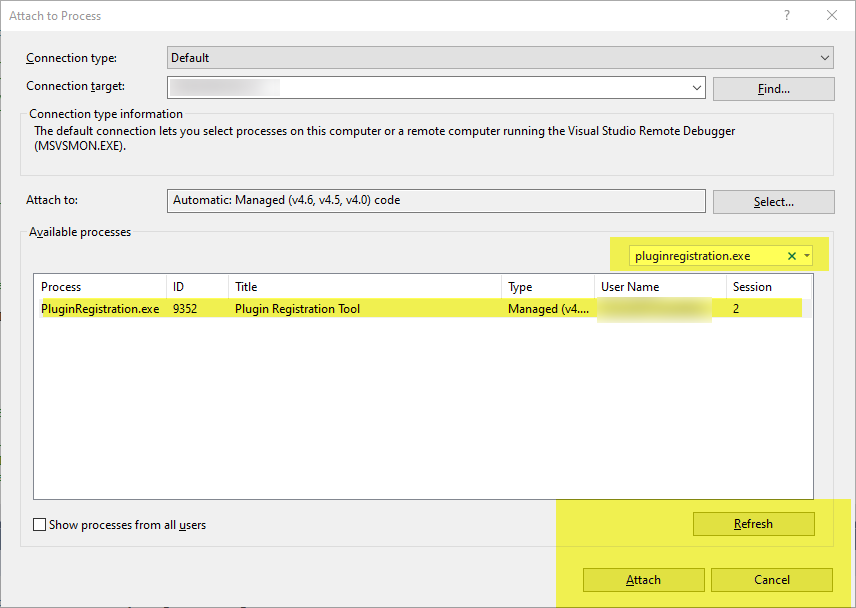
Search for Pluginregistration.exe from the Available processes and click on Attach, if you can’t find any, click on Refresh and search again.
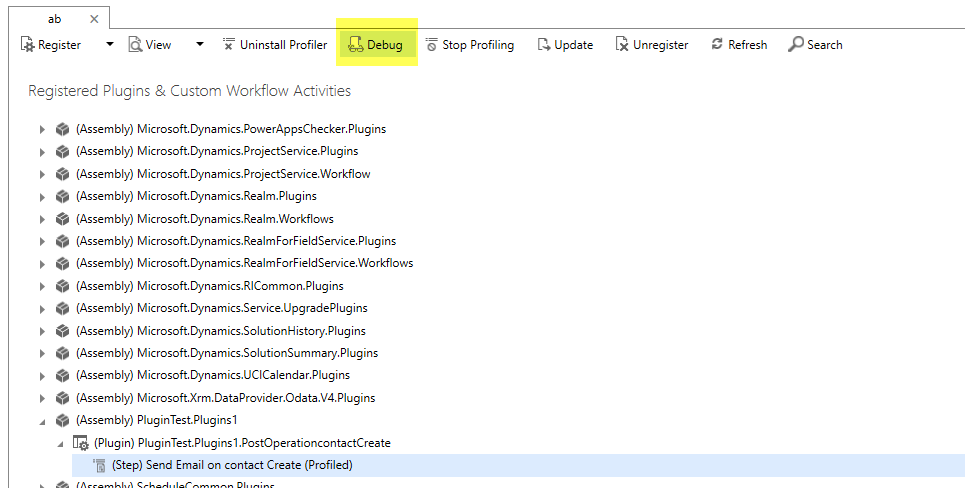
Once the process is attached, go back to the Plugin Registration Tool and click on Debug.
You will see a dialogue box. Provide the following there:
- Plugin Profile:
-
- Incase if you chose exception while setting up the profile, provide the file we downloaded previously which contains the serialized information of the plugin.
- If you selected Persist to entity, then select the Profile Log from the CRM.
- Assembly location: the DLL file of the Visual Studio Plugin Solution.
- Plugin: Select the Plugin from the dropdown list.
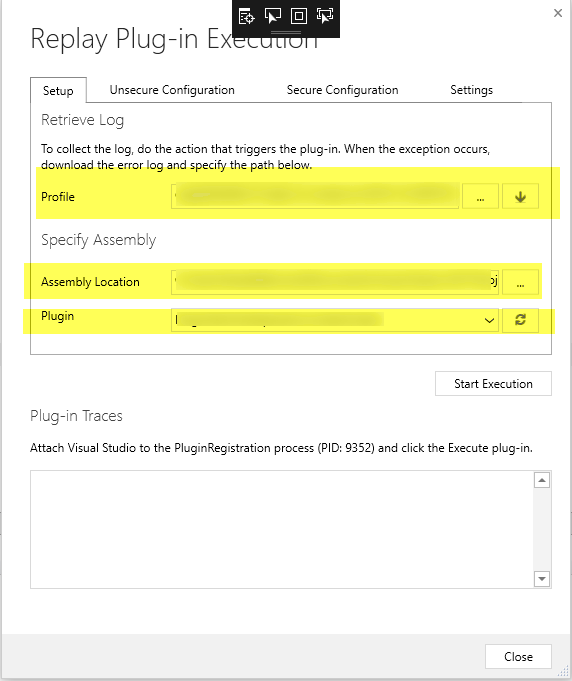
Click on Start Execution to hit the breakpoint we inserted in Visual Studio. You can now debug the code.
Conclusion
In this blog, we learned how to set up the plugin profiler and debug a plugin in an online environment of CRM. I hope that this brings clarity and ease to your plugin dilemmas. Don’t hesitate to leave us a comment in case you have a question! You can also connect with our BOLDEnthusiasts by clicking here.
Happy debugging!
Explore Recent Blog Posts


