Every organization needs to track its performance and business objectives whether they are achieved or not. It enables them to align everyone’s effort to the same high-level objectives, helps clarify ideas, ensures time and resources are used efficiently, and contributes to the company’s growth and progress. However, it is not always possible to manually assign goals to the employees or departments and keep track of their progress. A quick fix to this challenge is leveraging Power BI goals tracking. Let’s start with the basics and then drill deep into how you can use Power BI for goal tracking and why it is convenient.
Power BI Goals
Microsoft has announced a new tool, ‘GOALS’ in Power BI, enabling users to keep track of their business objectives and metrics. It is a Power BI Premium Feature and, for now, is in Public Preview.
‘Goals’ is a data-driven, adaptable way to measure objectives and metrics built directly on Power BI. It allows users to create business objectives and assemble them in a single and unified view. That curated data in Power BI is then used to measure progress against those metrics by creating scorecards. Scorecards help you to track your progress towards related goals and sub goals. The updates can be shared with the teammates, and suitable measures can be taken if teams lag their goals. This helps customers to monitor the health of their businesses.
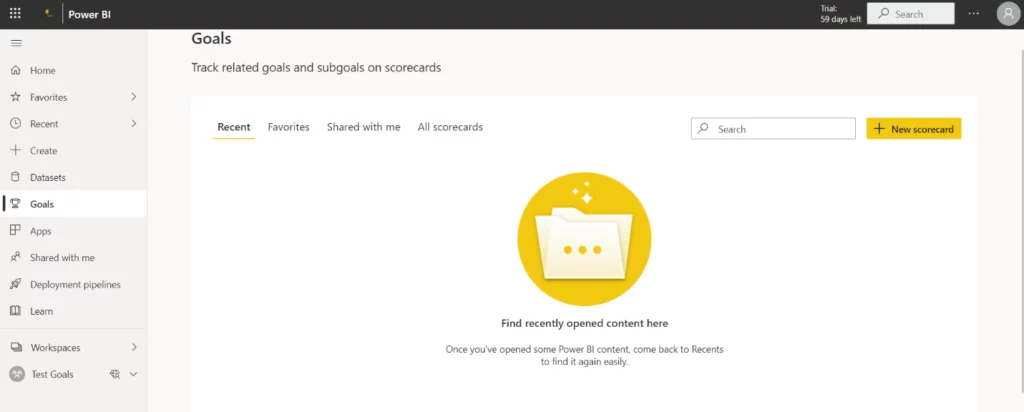
To get started, first, you need to create a Premium Workspace. After creating the Workspace, select Goals from the Navigation Pane. This page has the option of New Scorecards, where you can create your scorecards. Click on the ‘New scorecard’ button.
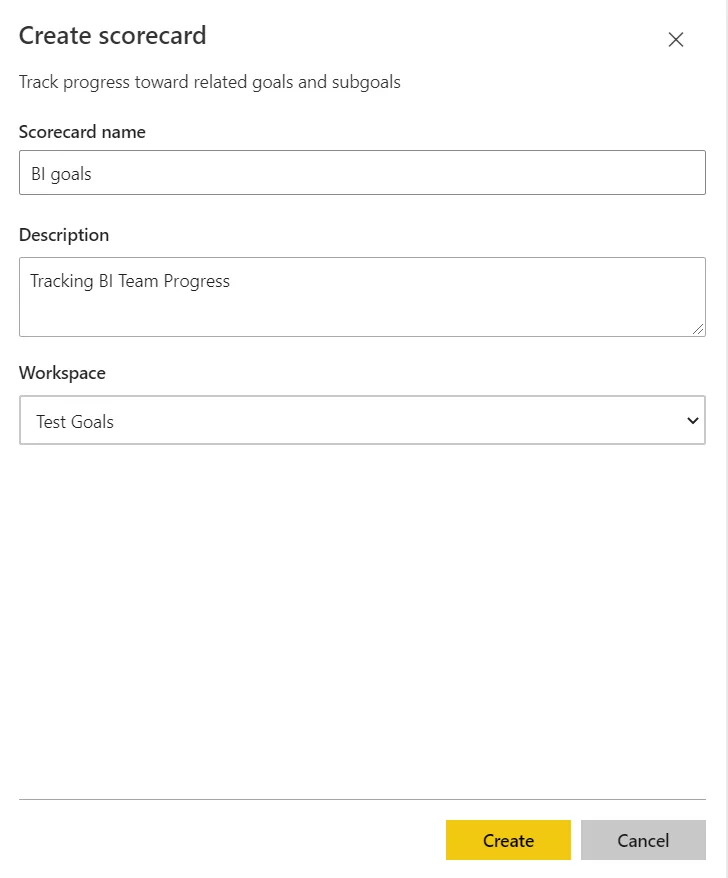
To create the scorecard, you will have to provide the name of the scorecard, its description, and the name of the premium workspace. If you do not have a premium workspace, then you must create one before creating a scorecard.
Get Real-Time Insights and Achieve your Business Goals
Stay ahead of the competition with real-time performance monitoring. Learn how AlphaBOLD Power BI services can transform your business.
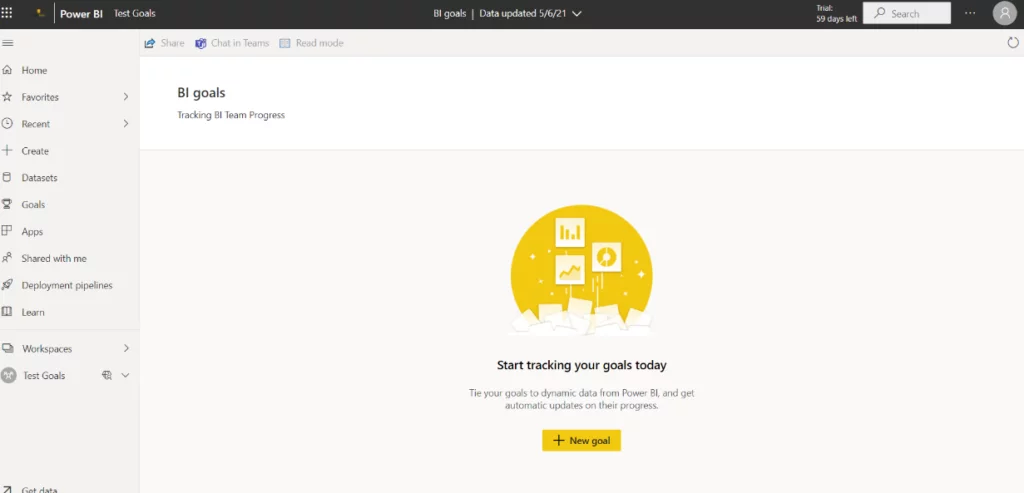
After creating the scorecard successfully, you must add goals against which you can track the performance. For this, click on ‘New goals.’
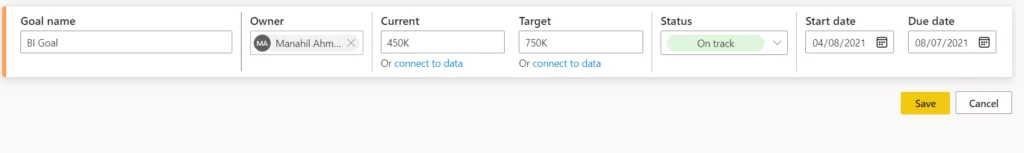
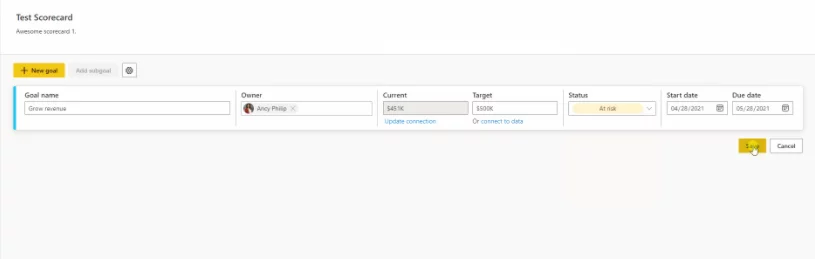
To add a new goal, you must provide metadata for that goal. It includes the goal’s name, the owner (can be any person or group), current value, target value, status, start date, and due date. Users have the flexibility to connect to data from Power BI apps or reports to provide current and a target value, or they can themselves type them in.
The user can give the current state of whether it is on track, at-risk, or behind in status. The due date defines the deadline for the goal.
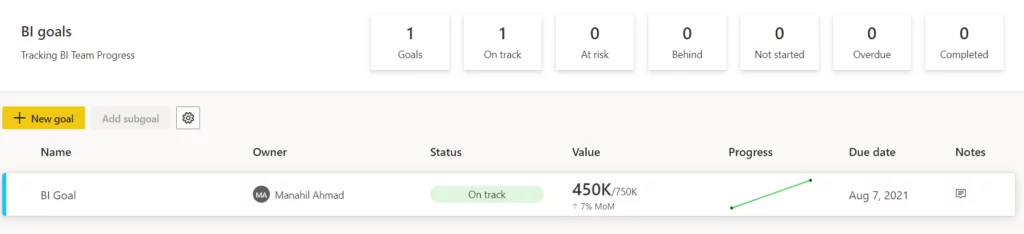
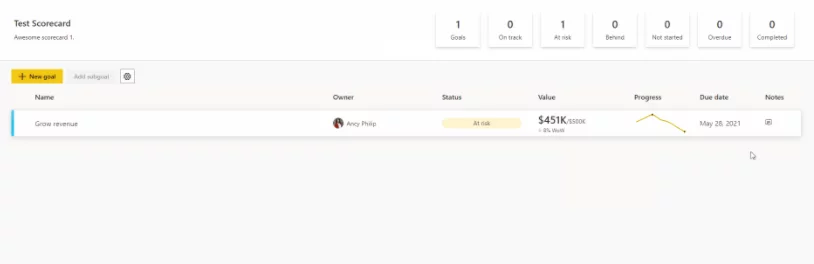
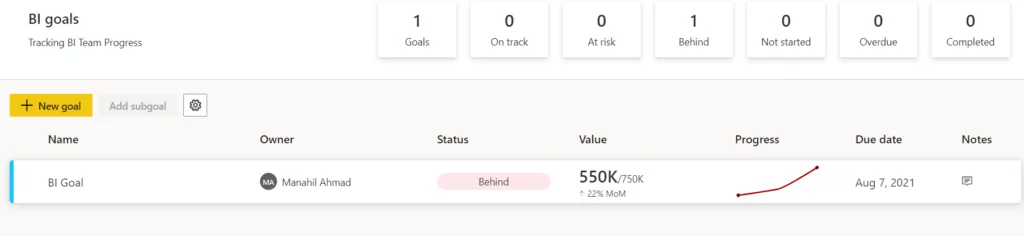
Once the goal is added, it creates a scorecard for that goal which shows all the details related to it and the progress towards the goal as you can see below.
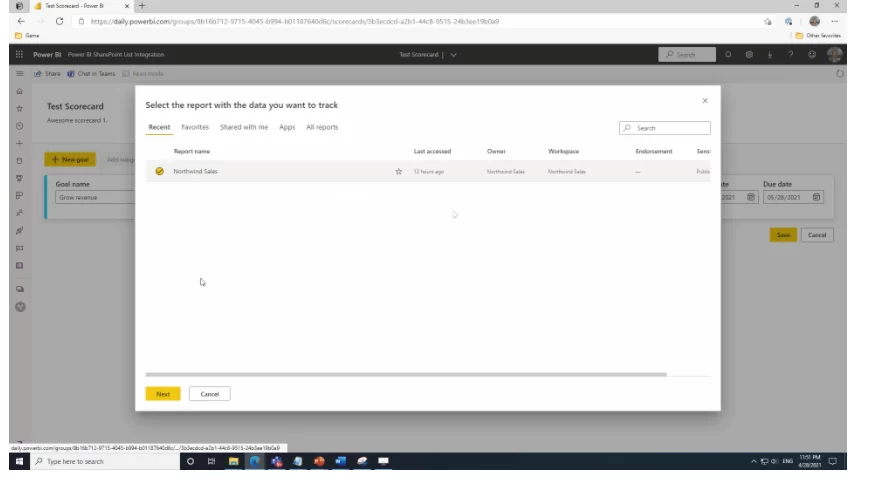
To use the ‘connect to data’ feature, you must click to connect to data to get the current or target value. Once you click it, it shows you the list of reports in your workspaces so that you can select the report with which you want to connect your data.
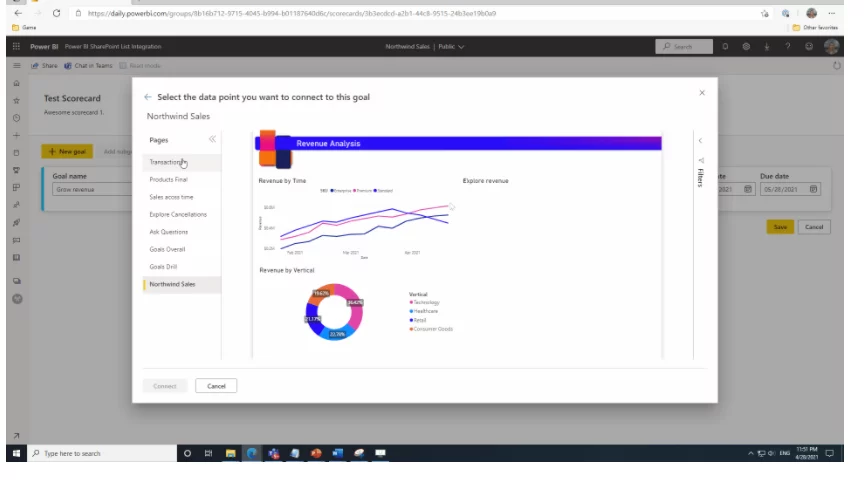
Once the report is selected, the user must select the data point to connect to the goal.
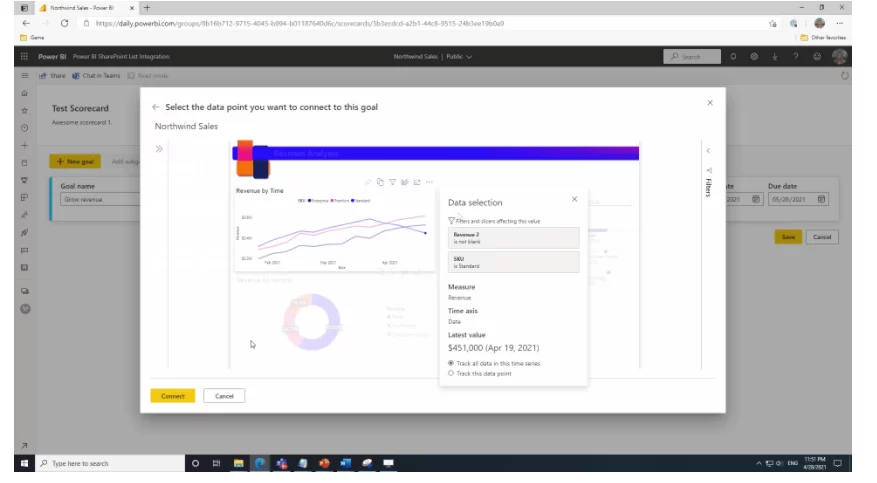
After selecting the data point, it automatically fills the current value with that data point. Similarly, users can select data points for target value using this connect to data feature.
Drive Peak Business Performance with Power BI & AlphaBOLD
Are you a decision-maker stuck with low operational efficiency leading to bad ROI? Experience how Power BI services can help you monitor and achieve your business objectives.
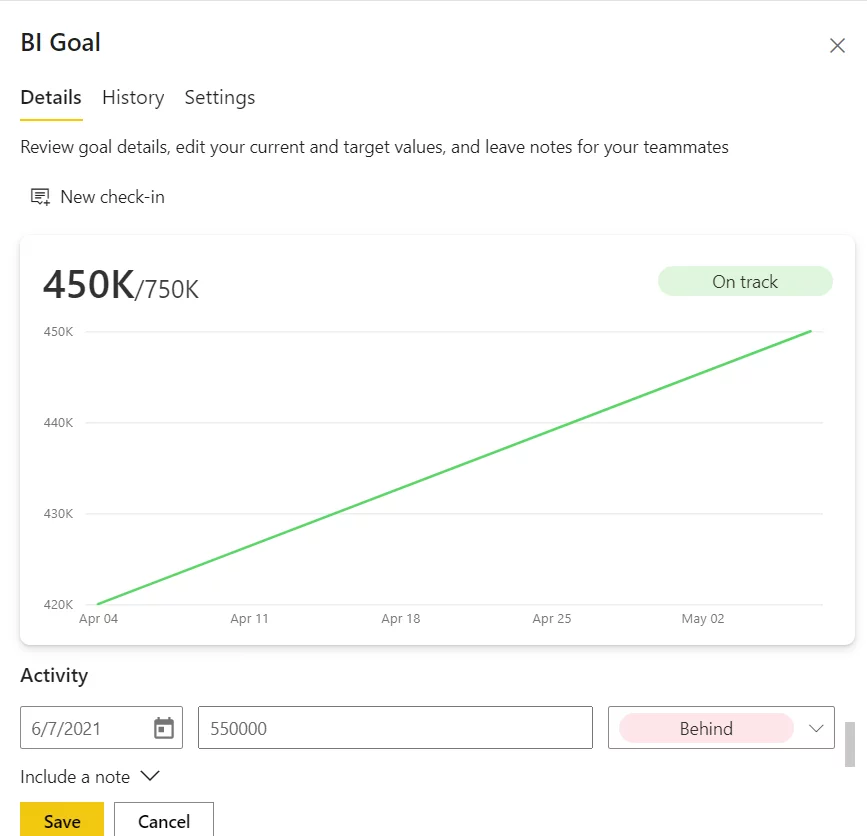
Users can drill further into scorecards to add notes and additional details to keep the team up to date with the progress. Power BI can bring the full history of the data from the start date. The detail page allows users to create check-ins. This experience helps users to update or add goal values, statuses, and notes. For this, simply navigate to the scorecard and click on the goal name. It will automatically show the details in the following image.
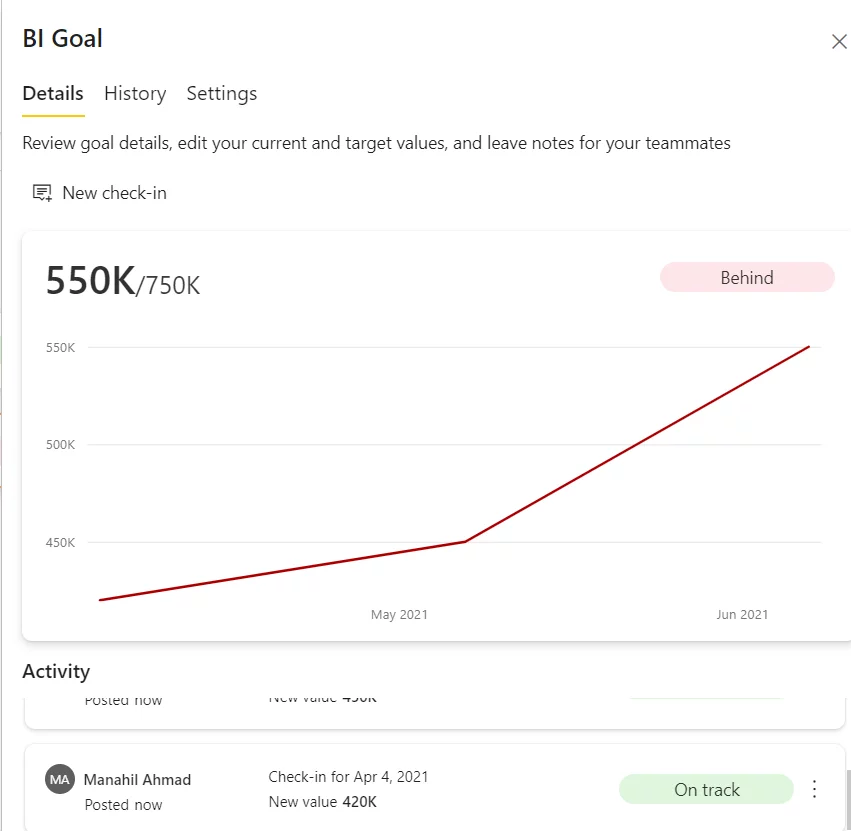
Here we can see, once we have changed the target value and status of the goal to behind, the trend line also changes, showing that the goal is behind. So whenever a user wants to investigate why a goal is at risk or behind they can check the detail of the data.
The scorecard also updates the status and progress once the goal is updated.
Subgoals:
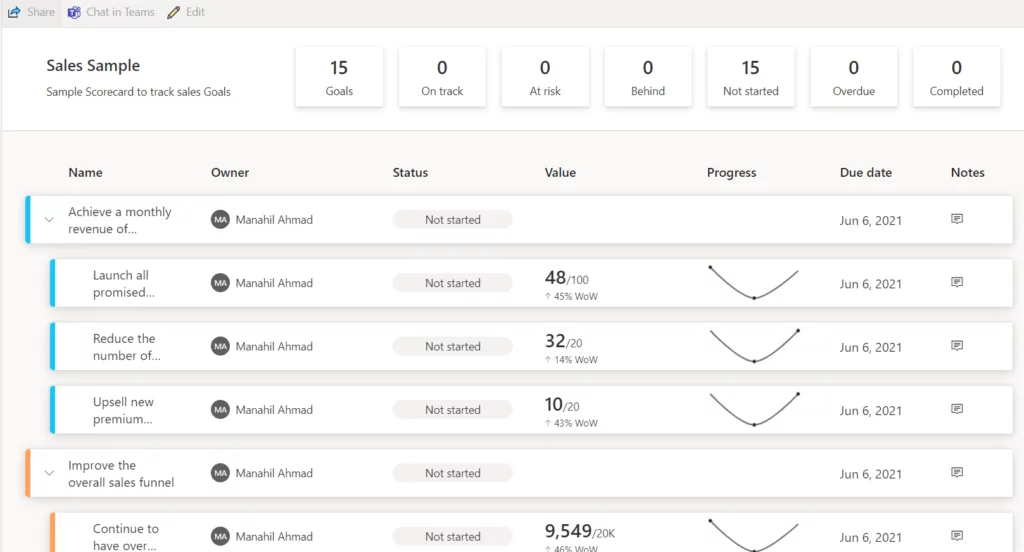
After creating the goals, users can further develop subgoals and see their progress through the trend line, as shown in the following image from the sample scorecards.
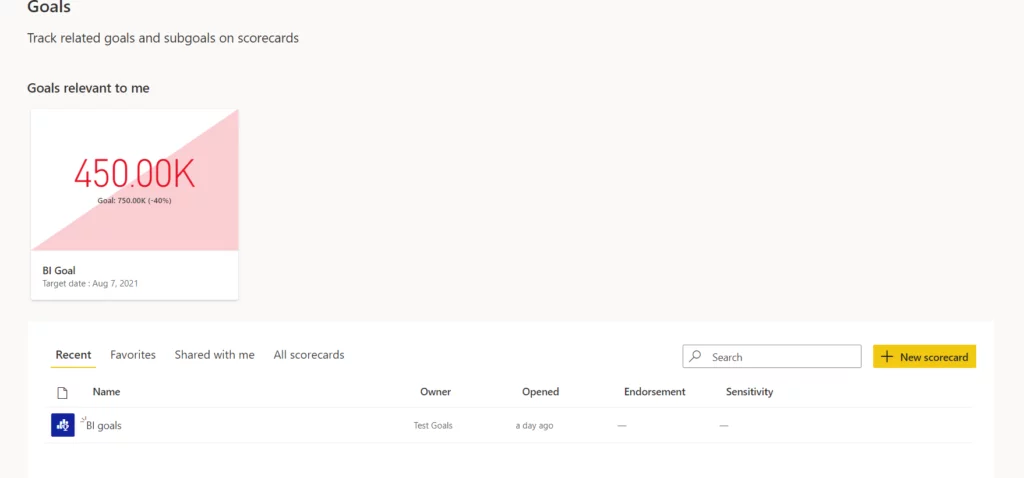
So now, when we select goals from our navigation pane, it will simply show us our scorecard there. Even all the scorecards created by the user will appear here, and the user can easily keep track of each.
This feature is only available for the Premium Power BI Capacity
Row-level security is not enforced.
Mobile experience not enabled yet.
In a table with more than one column of measures, Power BI selects the first measure in the row while using connect to data feature.
Update statuses manually.
Conclusion
Microsoft has planned plenty to capability updates for 2024.
It plans to provide mobile experience for Power BI Goals to make it easier for users to track their goals.
Rolls ups could be defined in future.
Users will be able to customize their scorecards.
In Power BI desktop, a scorecard visual will be introduced.
With the help of these exciting features, it would be easier for users to track their goals, monitor the health of their business, and contribute to their company’s growth and progress effortlessly.
Here are some additional resources for your knowledge that will help you make an informed decision:
Moreover, you can always leverage partner help to tap in Power BI goal tracking capabilities. As a well-reputed Microsoft Solution Provider AlphaBOLD has helped both enterprise-level and startups implement and optimize Power BI in line with their business requirements and scope. You can request for a demo and well take it up from there.