Power BI Paginated Reports are a powerful tool for organizations that need to produce highly formatted, pixel-perfect reports that can span across multiple pages. These reports are ideal for use cases such as invoices, financial statements, purchase orders, and any report that requires a fixed layout and needs to be printed or exported into formats like PDF or Excel. Unlike Power BI’s interactive reports, paginated reports are designed to deliver detailed, paginated data ideal for print distribution.
While Paginated Reports offer robust formatting options and high-level control over how the data is presented, they come with certain limitations that users should be aware of. This blog will explore these limitations and provide workarounds to help you make the most of Power BI Paginated Reports.
Before you start the blog, these are the things that you should be familiar with:
Power BI and SSRS
Paginated Reports
Power BI Report Builder
Limitations
1. Searching List Parameters:
The Limitation:
In SSRS, we can search for a List Parameter by clicking on it and typing letters or numbers, and it would take us to the searched value where we can select it.
Example:
For example, if we have the names of countries in a List Parameter, and we press the keys ‘A’ + ‘U’ + ‘S’, it will take us to Australia.
However, this functionality is not supported in Power BI Paginated Reports. When we click on a List Parameter, we cannot search for it. Therefore, the user may have to scroll through thousands of values in a list to select a single value.
Workaround:
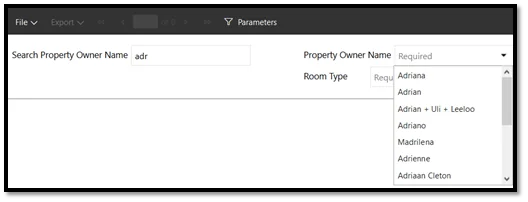
To fix this limitation, we provide a text box Parameter with each List Parameter. The user can write the value to be searched in that textbox Parameter, and the List Parameter will be narrowed down accordingly.
For example, if the user writes ‘Aus’ in the text field, the List Parameter will be narrowed to ‘Australia’ and ‘Austria’.
Process:
I have a sample dataset of over a thousand property listings. Each property has a property owner, so there are more than a thousand owners. Consequently, there are more than a thousand owners. If we provide the property owner’s name in the List Parameter, we must scroll through all those values to find the one we seek.
To work around this issue, first, create a textbox parameter in which we will enter the name to be searched.
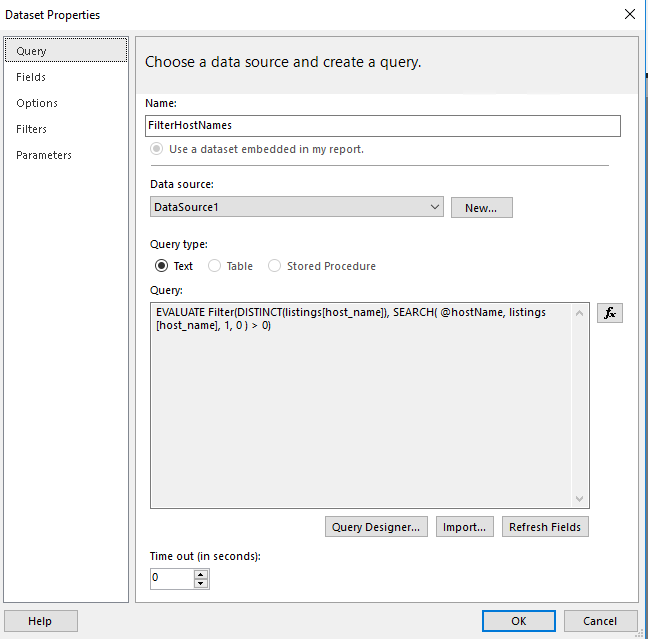
Create a new dataset containing all distinct property owner name values to be searched. By creating a new dataset just for the distinct names, we will gain performance in querying this small dataset rather than the whole table. I have used DAX syntax to query the data since I am sourcing data from the XMLA endpoint of the Power BI Dataset.
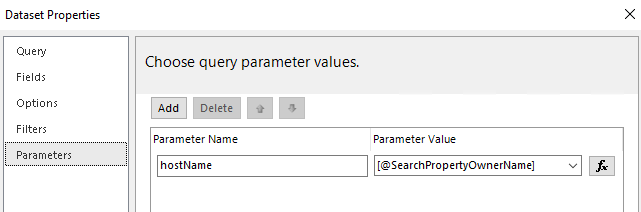
Use a parameter in this dataset (hostname in this case) to filter out values for the List Parameters. Set the value of the hostName parameter to the textbox parameter value.
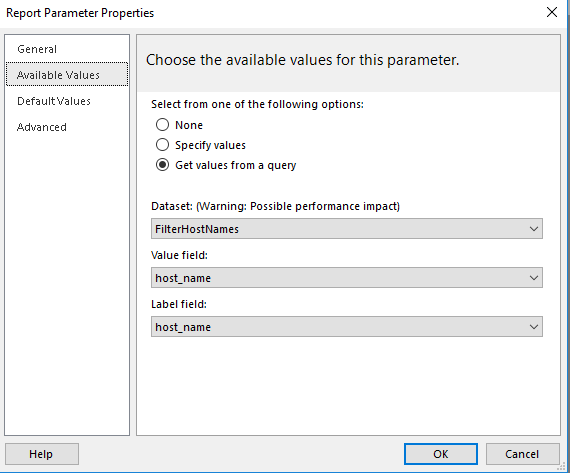
Edit the List Parameter and set its Available Values field to the newly created dataset in the previous step.
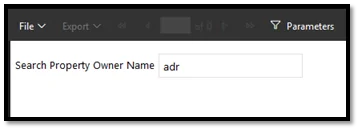
The textbox will now serve as the search box for the List parameter. Note: When you enter a value in the textbox, use Tab instead of Enter because Tab will refresh the List Parameter, whereas Enter will run the report.
When you press Tab, the List Parameter will be narrowed to the desired result.
When we export a Paginated Report to CSV format, certain limitations are inherent to the CSV format itself. For example, the CSV format can’t show subtotals and totals integral to Paginated Reports and Excel reports. Also, we can format Column headers and rows and change their colors, font, and weight in Paginated Reports, but we can’t have that functionality in a CSV file.
Example:
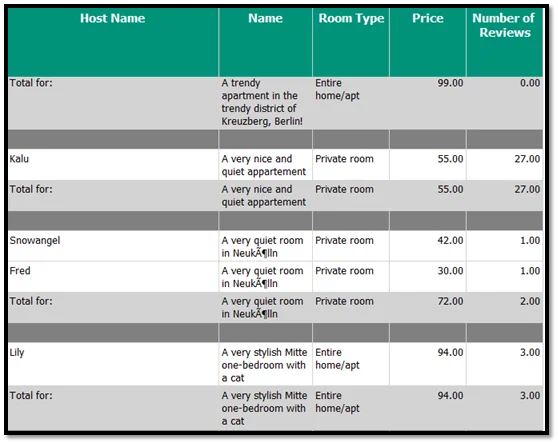
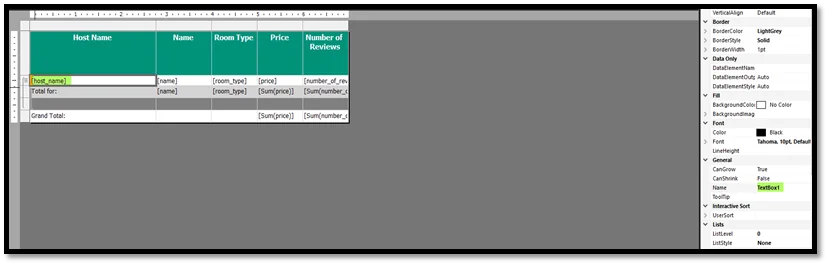
Below is a screenshot of the Property Listings report containing sub-totals and totals for individual properties.
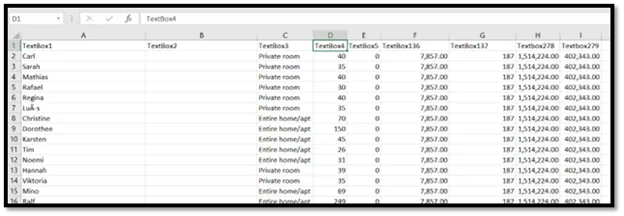
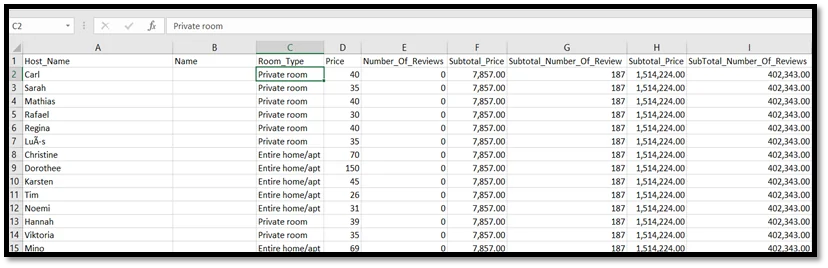
However, when we export this report into CSV format, we immediately notice that the layout differs vastly from the Paginated Report. There are only five columns in the Paginated Report, but the CSV shows four additional columns. Also, the names of the columns are not very meaningful. What’s happening is that the column names are selected from the Paginated Reports’ textbox names.
Workaround:
The four additional columns are the sub-total and total values against each row. Instead of showing them on separate rows (as in the Paginated Report), they are appended as columns against each row. This is because the CSV format doesn’t support any grouping or aggregation.
The column names are picked from the textbox names of the Paginated Reports. We need to change the textbox names of the report itself so that this change is reflected in the exported CSV.
Process:
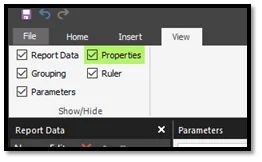
Open the report in Report Builder and check the Properties checkbox in the View tab.
Then, click on the individual textboxes, and their names will be shown in the Properties menu on the right side. Change the names of the textboxes from here. There is a limitation on what characters can be used for the textbox naming. You can only use alphabets, numbers, and underscores.
Also, click on the sub-total and total textboxes and change their names accordingly.
After changing the textbox names, publish the report on Power BI Premium and export the results again. The CSV will now have the updated column names. Notice that the last four columns have Subtotal and Total prefixes because they have the aggregated values for the Price and Number_Of_Reviews columns.
Need Expert Help Navigating Power BI Limitations?
Partner with AlphaBOLD for tailored Power BI solutions, including optimized Paginated Reports in Power BI that overcome platform constraints and deliver pixel-perfect reporting precision.
When dealing with large datasets in Power BI Paginated Reports, exporting reports to formats like PDF or Excel can be slow. The export process can fail due to memory limitations, especially with reports containing thousands of rows or complex sub-reports.
Workaround:
To enhance performance, divide large reports into smaller sections by leveraging pagination. This will break the report into multiple pages, improving performance and user experience.
Another solution is to optimize the report layout by reducing unnecessary fields or calculations in the report and simplifying complex sub-reports. A more streamlined design helps ensure the export process is faster and more efficient.
4. Limited Custom Visuals and Formatting Options:
The Limitation:
Power BI Paginated Reports do not support custom visuals or advanced formatting options, as available on the Power BI desktop. Compared to Power BI desktops, they offer minimal flexibility in design and customization. This limitation is for users looking to create highly engaging, visually interactive reports.
Workaround:
While custom visuals are not supported in Paginated Reports, you can still leverage conditional formatting to draw attention to specific metrics. You can use different font sizes, colors, and styles to emphasize key data points. Furthermore, you can create clean, professional layouts using tables, charts, and matrices that balance clarity and aesthetics.
If you need advanced visualizations, consider using Power BI Desktop reports alongside Paginated Reports in your dashboard to combine interactive visuals with detailed static reports.
Power BI Paginated Reports are specifically designed to produce pixel-perfect, print-ready outputs, which means they are not naturally suited for mobile device optimization. Due to their fixed layouts and precise pagination, these reports do not adjust well to smaller screen sizes, leading to a less-than-ideal mobile experience.
Users may need to zoom in or scroll horizontally to view content, and page breaks can disrupt mobile navigation. Additionally, Paginated Reports lack mobile-friendly interactive features, making them less flexible for mobile use than Power BI’s interactive reports.
Workaround:
To improve the mobile experience, consider simplifying the report layout by reducing column count, using smaller font sizes, and avoiding complex tables or grids that may not display well on smaller screens.
Additionally, for more fluid mobile navigation, you can create a companion interactive report using Power BI’s mobile-friendly features or design the Paginated Report with a narrow layout to ensure the content fits better on mobile. For users who require a highly interactive and responsive experience on mobile devices, transitioning to Power BI interactive reports would be the most effective solution and providing links to the paginated version for export-only needs.
Power BI Paginated Reports is a robust solution for generating precisely formatted, print-ready reports. However, certain limitations can impact the reporting experience. Understanding these limitations and applying the right workarounds can help you make the most of this tool and deliver more user-friendly and practical reports.
As Power BI continues to evolve, we can expect even more enhancements and features that will help improve the flexibility and usability of Paginated Reports, making them even more valuable for businesses.